Author: LBank Research Analyst: Ludo
Disclaimer: This report is compiled and analyzed from publicly available information and is intended solely for information sharing and research discussion. It does not constitute investment advice, a securities recommendation, a trading instruction, or any guarantee of returns. The company operations, valuations, market prices, and consensus expectations discussed herein may change over time. Readers should independently verify the data and make their own decisions.
1. Core Conclusion
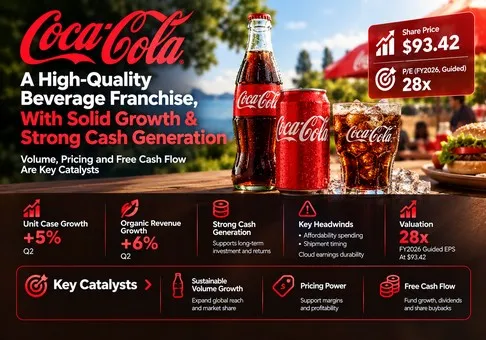
Overall judgment: The Coca-Cola Company is a high-quality beverage franchise and a net competitive beneficiary, but the stock is expensive at approximately 28.3–28.6 times guided FY2026 comparable earnings. The risk/reward is moderately negative at the October 19 close of USD 93.42. The decisive variable is whether volume recovery produces durable cash earnings after affordability spending and marketing investment.
-
Demand recovery is credible. Second-quarter unit case growth of 5% accompanied 6% organic revenue growth. That combination supports a healthier franchise than a purely inflation-led revenue increase. However, sporting-event activation and shipment timing mean the latest quarter should not be extrapolated unchanged into a long-run demand assumption.
-
The financial recovery deserves recognition, with a cash-flow qualification. H1 operating cash flow of USD 7.543 billion less USD 684 million of capex produced USD 6.859 billion of FCF. The prior-year comparison includes the fairlife contingent payment, so the dramatic rebound overstates underlying operating acceleration. The appropriate test is delivery against annual guidance and the residual cash available after dividends.
-
Channel execution is improving, but the KFC win belongs to 2027. The October 15 agreement covers 3,600 U.S. restaurants, beginning in January with full rollout expected by spring. It strengthens the distribution thesis; it does not explain Q3 2026 sales or justify an invented contract value. Equipment, marketing and incentive costs can precede mature contract profits.
-
The valuation already demands successful execution. July guidance implies comparable EPS of USD 3.27–3.30, calculated from the FY2025 base of USD 3.00 and 9%–10% growth. Using approximately 4.303 billion Q2 average basic shares as a transparent equity-value proxy gives USD 402.0 billion and a 3.08% guided FCF yield. The share denominator is a period average, so this is an approximation rather than a live market-cap quote.
-
A satisfactory quarter alone may offer limited valuation protection. Analyst sensitivities, not price targets, give USD 75.60 at EPS USD 3.15 and 24 times earnings, USD 85.41 at EPS USD 3.285 and 26 times, and USD 100.05 at EPS USD 3.45 and 29 times. These correspond to approximately −19.1%, −8.6% and +7.1% versus USD 93.42, excluding dividends. The bullish case requires earnings above current guidance; the base case assumes guidance delivery with a lower multiple.
The multiple choices are research assumptions used to expose sensitivity, not observed historical averages or a peer-derived fair-value range. A one-turn change in the multiple moves value by USD 3.285 at base EPS. That is substantial relative to the earnings contribution from a small improvement in annual organic growth. Strong execution can therefore coexist with an unattractive incremental equity return.
2. Company Overview, Business Mix, and Core Operating Metrics
Coca-Cola earns money by owning beverage brands and formulas, selling concentrates and syrups to bottling partners, and selling finished products in selected businesses. Bottlers manufacture, package and distribute much of the system’s physical volume. The parent also supports advertising, category development and customer relationships. This structure gives the franchise reach without requiring every bottle, warehouse and delivery truck to sit on its consolidated balance sheet.
The product portfolio spans sparkling soft drinks, juice and value-added dairy, water, sports drinks, coffee and tea. Revenue reflects both consumption occasions and the economic value captured per occasion. Pack size, reusable packaging, channel and geography influence that capture. An affordable package can protect consumer access while reducing revenue per unit case; a premium product can improve mix while contributing relatively little physical volume.
Operating segments are geographic, alongside Bottling Investments. They are not product-level revenue disclosures. The following table uses third-party revenue, avoiding intersegment revenue double counting. Segment operating income includes intersegment economics; Corporate reconciles the segment total to consolidated operating income.
|
Q2 2026 business
|
Third-party revenue, USD million
|
Operating income, USD million
|
Economic role and constraint
|
|
North America
|
5,405
|
1,695
|
Largest revenue pool; concentrate, fountain and finished beverages; affordability and channel execution matter.
|
|
Europe, Middle East & Africa
|
3,087
|
1,309
|
Brand/franchise economics; marketing timing and country mix affect profit conversion.
|
|
Latin America
|
1,839
|
1,177
|
Strong concentrate economics; reported growth materially affected by currencies.
|
|
Asia Pacific
|
1,487
|
656
|
High volume opportunity; lower-price packages and country mix can dilute revenue per case.
|
|
Bottling Investments
|
1,525
|
91
|
|
|
Corporate / reconciliation
|
37
|
(256)
|
Corporate revenue and costs; consolidated revenue 13,380 and operating income 4,672.
|
Source basis: July 3, 2026 Form 10-Q, Note 16; figures in USD million. Corporate revenue is small and is included for reconciliation. The regional structure explains economic exposure more reliably than attributing an undisclosed profit contribution to an individual brand.
Core operating metrics and changes
|
Metric / event
|
Verified observation
|
Research interpretation
|
|
Q2 operating demand
|
Unit cases +5%; concentrate sales +4%; price/mix +2%
|
Separate consumer consumption from concentrate shipment timing.
|
|
Q2 category breadth
|
Zero Sugar +16%; water/sports/coffee/tea +6%; coffee −2%
|
Demand breadth is encouraging, but individual businesses still diverge.
|
|
Q2 profitability
|
GAAP margin 34.9%; comparable margin 35.6%; comparable EPS USD 0.97
|
Operating quality is strong; currency and adjustments influence EPS.
|
|
FY2026 guidance
|
Organic growth about 5%; comparable EPS +9%–10%; FCF about USD 12.4 billion
|
EPS implies USD 3.27–3.30 against the USD 3.00 FY2025 base.
|
|
Q3 reporting event
|
October 27 before NYSE open; call 8:30 a.m. ET
|
Results are unreleased as of this report; KFC contributes from 2027.
|
|
External expectations
|
TipRanks EPS USD 0.88; The Right Trader USD 0.87 / revenue USD 12.9 billion
|
Secondary snapshots accessed October 20; do not merge into a precise consensus.
|
Company growth percentages are rounded; organic growth, comparable margin and comparable EPS are non-GAAP. A case of final beverages sold by the system is not identical to a concentrate shipment recognized by the parent. This distinction is essential when inventory timing changes the apparent relationship between consumption and reported revenue.
The upcoming report is a test of the composition of growth. A larger revenue number driven by currency or a temporary shipment catch-up is less valuable than broad consumer demand with stable economics. Conversely, slightly slower unit growth could still be acceptable if price/mix improves and operating profit converts into cash. A single growth headline cannot distinguish those outcomes.
Published estimate snapshots disagree: TipRanks shows Q3 EPS of USD 0.88, while The Right Trader displays USD 0.87 and revenue of USD 12.9 billion. Both are secondary sources accessed October 20, and the latter page contains stale relative-date text. They provide context, not an authoritative live hurdle. The report anchors its judgment to official annual guidance and operating thresholds rather than claiming a precise consensus beat forecast.
3. Fundamental Quality
|
Financial metric
|
FY2025
|
H1 2025
|
H1 2026
|
|
Revenue, USD million
|
47,941
|
23,664
|
25,852
|
|
GAAP operating income, USD million
|
13,762
|
7,939
|
9,031
|
|
GAAP operating margin
|
28.71%
|
33.55%
|
34.93%
|
|
GAAP diluted EPS, USD
|
3.04
|
1.65
|
1.94
|
|
Operating cash flow, USD million
|
7,408
|
(1,391)
|
7,543
|
|
Capital expenditures, USD million
|
2,112
|
751
|
684
|
|
FCF: OCF less capex, USD million
|
5,296
|
(2,142)
|
6,859
|
|
Cash plus short-term investments, USD million
|
13,872
|
Not used
|
13,529
|
|
Gross borrowings, USD million
|
45,492
|
Not used
|
43,543
|
Source basis: FY2025 Form 10-K and H1 2026 Form 10-Q. Annual and half-year periods are not directly interchangeable; no half-year annualization is used. Margins and FCF are calculated. Balance-sheet comparisons are December 31, 2025 versus July 3, 2026. Gross borrowings equal loans/notes payable, current debt maturities and long-term debt; cash excludes separately classified marketable securities.
Growth quality is strong, but regional monetization is uneven. The brand and bottler network can turn modest improvements in consumption into attractive incremental profit. Still, more volume does not guarantee better economics. A lower-value country or package mix can offset the benefit of a larger installed consumer base. The strongest evidence is simultaneous improvement in consumption, value capture and cash generation.
Profitability is strong. The latest half-year GAAP operating margin approaches 35%, and the latest quarter’s comparable margin is higher. Such margins support the view that the parent captures valuable brand economics. They do not imply unlimited pricing power: consumer affordability, retailer negotiation and bottler profitability constrain what can be extracted from the system. Marketing cuts would also be a weak foundation for lasting margin expansion if they damage future demand.
Cash conversion has recovered, with important timing effects. FY2025 reported FCF was USD 5.296 billion; the company’s rounded FCF excluding the USD 6.1 billion fairlife contingent payment was USD 11.4 billion. That adjustment explains why reported year-on-year cash growth is a poor stand-alone operating indicator. The payment was a real economic acquisition cost even if it is unsuitable as a recurring annual expense. Normalizing it is useful for forecasting, while retaining it is necessary for evaluating capital allocation.
The balance sheet is sound but leveraged. Gross borrowings of USD 43.543 billion exceed cash and short-term investments of USD 13.529 billion, leaving a simplified net borrowing position of USD 30.014 billion. The calculation excludes marketable securities, leases and other claims, so it is not a full enterprise-value adjustment. Recurring earnings support debt service, but the company has less freedom than a net-cash business to absorb large unexpected legal or tax payments.
Capital allocation is supported by cash generation. H1 dividends of USD 4.562 billion and treasury-share purchases of USD 663 million together consumed USD 5.225 billion. Against FCF of USD 6.859 billion, that leaves approximately USD 1.634 billion before other investment and financing flows. Repurchases are a use of cash rather than an operating growth engine, and high valuation reduces the economic benefit of each repurchased share.
A reproducible operating-to-valuation bridge
The key variable is cash profit per incremental consumption occasion. For a transparent annual sensitivity, use FY2025 revenue of USD 47.941 billion as an exposure base. One additional percentage point of revenue growth adds USD 479.41 million. Assuming that incremental revenue earns the Q2 comparable operating margin of 35.6%, incremental operating profit is USD 170.67 million. Applying the guided underlying tax rate of 19.9% gives approximately USD 136.71 million after tax, or USD 0.0317 per share using 4.313 billion diluted shares.
At an assumed 80% incremental cash conversion, the same change adds approximately USD 109.37 million of FCF. At an assumed 26 times earnings, the EPS increase translates into about USD 0.82 of equity value per share. Every margin, tax, share and conversion assumption is explicit. This is a static sensitivity, not company guidance: it holds financing and share count fixed, omits working-capital seasonality and treats average operating margin as an incremental-margin approximation.
The conclusion follows directly. Distribution wins and organic growth help intrinsic earning power, but a small growth surprise does not automatically offset multiple compression. A sustainable valuation rerating would require evidence that incremental economics are better or more durable than these assumptions, rather than simply a larger count of physical cases.
4. Industry and Competitive Landscape
The relevant market is nonalcoholic ready-to-drink beverages, with adjacent competition from coffee, energy and functional drinks. Consumers choose among occasions, price points and channels; competition is broader than cola brand preference. The value chain divides brand ownership and concentrate economics from manufacturing, distribution, retail access and foodservice equipment. Comparing a franchisor directly with a consolidated bottler without accounting for that split would misstate profitability.
|
Competitive arena
|
Verified evidence / scale
|
Who gains or loses
|
Valuation implication
|
|
U.S. foodservice access
|
KFC U.S.: 3,600 restaurants; transition begins January 2027
|
Coca-Cola wins the new account; PepsiCo loses this account
|
Distribution advantage strengthens; undisclosed economics prevent a quantified EPS uplift.
|
|
Mainstream North American beverages
|
KO Q2 unit cases +3%; PBNA Q3 beverage volume −2%
|
KO shows stronger disclosed momentum; periods differ
|
Supports a quality premium without establishing simultaneous market-share transfers.
|
|
U.S. refreshment beverages
|
KDP Q2 segment revenue +10%; volume/mix +6.5%
|
KDP is also winning demand
|
Competition limits the case for assuming all category growth accrues to KO.
|
|
Energy and functional occasions
|
Monster Q2 sales +20.2%; FX-adjusted +17.9%
|
Monster wins category growth; KO participates through its investment and distribution relationship
|
KO is a net beneficiary of system breadth; Monster growth is not KO consolidated revenue.
|
|
Emerging-market affordability
|
KO Asia Pacific cases +8%, price/mix −9%, value-share loss
|
Volume recovery has not yet delivered broad regional economic improvement
|
A premium multiple requires revenue and profit per occasion to improve.
|
Source basis: company earnings releases and the October 15 KFC announcement. No independently verified numerical global market share is assumed. Value-share gains disclosed by management are directional and do not establish a precise share percentage.
|
Company / period
|
Revenue scale
|
Growth / operating KPI
|
Profitability and comparison basis
|
|
The Coca-Cola Company / Q2 2026
|
USD 13.380 billion
|
Reported +7%; organic +6%; unit cases +5%
|
GAAP operating margin 34.9%; comparable 35.6%.
|
|
PepsiCo, Inc. / Q3 2026
|
USD 25.274 billion consolidated
|
Organic +3.1%; PBNA organic approximately flat and beverage volume −2%
|
Consolidated GAAP operating margin 16.86%; PBNA core currency-neutral profit +4%.
|
|
Keurig Dr Pepper Inc. / Q2 2026
|
USD 7.3 billion consolidated; USD 2.9 billion U.S. Refreshment Beverages
|
Legacy KDP sales +7.3%; refreshment segment +10.0%
|
Refreshment adjusted operating margin 29.9%; acquisition distorts consolidated growth.
|
|
Monster Beverage Corporation / Q2 2026
|
USD 2.54 billion
|
Reported +20.2%; FX-adjusted +17.9%
|
Operating income USD 740.4 million; derived GAAP margin about 29.1%.
|
Periods and accounting definitions differ. PepsiCo’s Q3 covers 12 weeks ended September 5 and includes substantial food operations; the other observations are Q2. KDP’s acquired coffee operations make consolidated growth unsuitable for a beverage-demand comparison. Segment margins are approximate comparators to KO’s consolidated franchise model. Monster is both a competitor for consumption occasions and a strategic investment/distribution partner for Coca-Cola. Its sales must not be added to KO’s consolidated revenue.
The competitive winners are Coca-Cola in U.S. foodservice, KDP in refreshment beverages, and Monster in energy-led growth. PepsiCo’s North American beverage business is the weaker disclosed volume performer and loses the KFC account. This judgment concerns the cited businesses and periods; it is not a claim that PepsiCo’s entire global franchise is structurally impaired. Its international beverage performance remains a counterweight to North American weakness.
Coca-Cola is a net beneficiary because its brand portfolio and route-to-market access allow it to participate across several demand pools. The important qualification is that a strong network still requires investment and local affordability. KDP’s execution demonstrates that competition is active, while Asia Pacific’s combination of volume growth and negative price/mix shows the cost of pursuing consumption without immediate improvement in monetization.
The KFC agreement is strategically meaningful as evidence that a large foodservice customer values the portfolio and system. The economic contribution remains undisclosed. Parent concentrate revenue, bottler revenue and restaurant beverage receipts represent different portions of the value chain; multiplying restaurant count by retail beverage spending would overstate the parent’s potential revenue. The research case therefore assigns the agreement qualitative support and zero specifically modeled EPS uplift.
October 27 scenario framework
A bullish operating print would combine organic growth of at least 6%, global unit cases of at least 4%, Q3 comparable EPS around USD 0.91 or higher, and evidence that annual EPS can exceed USD 3.30 without a weaker cash outlook. The full-year upside sensitivity of USD 3.45 requires more than this single-quarter threshold and should be treated as a stretch earnings outcome, not an automatic extrapolation.
The base case is organic growth of 4%–5%, positive case growth, Q3 comparable EPS around USD 0.87–0.89 and delivery of annual EPS within USD 3.27–3.30 alongside approximately USD 12.4 billion FCF. The bearish operating case is organic growth below 4%, flat or negative cases, Q3 comparable EPS around USD 0.84 or lower, or a cash-flow guidance reduction. These are analyst monitoring scenarios, not management forecasts or a verified distribution of market expectations. No options-implied move or historical reaction probability is assumed.
5. Key Risks
-
Affordability weakens monetization. If global price/mix turns negative or North American case growth falls to zero despite promotional spending, revenue capture per occasion deteriorates. That would reduce incremental profit and undermine a premium valuation even if headline system volume remains positive.
-
The event-driven volume boost fades. If case growth normalizes sharply after the FIFA World Cup activation, concentrate shipments may initially mask a consumption slowdown. Subsequent inventory adjustment could then depress parent revenue and increase quarterly earnings volatility.
-
Input and distribution costs exceed pricing. Sustained increases in packaging, freight, sweeteners or dairy costs, combined with limited retail pricing flexibility, would squeeze company and bottler economics. Lower partner profitability could also impair route investment and service quality.
-
Currency and portfolio changes obscure operations. If currency tailwinds reverse or the Africa bottling disposal timing differs from July assumptions, reported revenue and EPS can diverge from organic performance. Comparing a changed consolidated perimeter with the previous year could create an unjustified growth or margin narrative.
-
Cash recovery proves less recurring. If working capital reverses or capex accelerates without higher operating cash flow, annual FCF could miss USD 12.4 billion. Dividend and debt-service obligations would then absorb a larger portion of available cash, reducing capital-allocation flexibility.
-
Tax litigation produces material cash demands. An unfavorable development in the IRS transfer-pricing dispute could increase payments, financing needs or uncertainty around future taxes. The operating earnings multiple does not capture that risk through a simple current-quarter EPS comparison.
-
Foodservice gains have delayed or weaker economics. KFC implementation costs, customer incentives or a slower rollout could postpone contribution. Additional distribution wins would not necessarily create attractive returns if acquisition and support costs are too high.
-
The quality premium compresses. A move from the current guided-earnings multiple toward 26 times would reduce value even if the company delivers its profit plan. Higher discount rates or a market preference for faster growth can trigger this outcome without operational failure.
6. Monitoring Checklist
-
October 27 results and 8:30 a.m. ET call: organic growth of at least 5% supports the operating thesis; below 4% weakens it. Compare the result with underlying demand, not only the reported revenue number.
-
Global unit cases and concentrate shipments: at least 3% case growth with no persistent shipment outperformance strengthens confidence; flat cases with faster shipments signals possible inventory timing rather than consumption growth.
-
North American demand and pricing: positive cases alongside positive price/mix supports durable value capture. Zero or negative cases despite more promotions would weaken the premium-quality case.
-
Asia Pacific monetization: a price/mix decline narrowing from Q2’s −9%, combined with positive cases and better comparable currency-neutral profit, supports recovery. Persistent negative mix and flat profit weaken it.
-
Margin durability: comparable operating margin near or above 35% supports operating leverage; below 34% without a clear temporary investment explanation challenges the incremental-profit assumptions. These are analyst thresholds, not company quarterly guidance.
-
Annual earnings and cash outlook: maintain EPS of USD 3.27–3.30 and FCF near USD 12.4 billion as the baseline. A sustained increase in both is more convincing than an EPS raise driven mainly by currency or tax effects.
-
KFC rollout and portfolio perimeter: monitor January 2027 commencement, spring completion and disclosed economics; separately track Africa bottling disposal timing. Do not book undisclosed contract profits or equate disposal proceeds with recurring FCF.
-
Valuation discipline: recalculate price divided by updated comparable EPS. Above 29 times requires a stronger durability argument; at or below 26 times with stable earnings and cash guidance would improve risk/reward. These are assessment thresholds rather than buy/sell instructions.
7. Sources
-
KOON/USDT Spot Trading | LBank (https://www.lbank.com/trade/koon_usdt) — Retrieved October 20, 2026 through command-line HTTP; populated price, daily range, nonzero USDT turnover and buy/sell controls; archived HTML. Snapshot token quote excluded from equity valuation.
-
-
AMDON/USDT Spot Trading | LBank (https://www.lbank.com/trade/amdon_usdt) — Retrieved October 20 before selection; populated trading interface; screened candidate, excluded by 90-day coverage rule.
-
-
COSTON/USDT Spot Trading | LBank (https://www.lbank.com/trade/coston_usdt) — Retrieved October 20 before selection; populated trading interface; screened candidate, excluded by 90-day coverage rule.
-
-
-
-
-
-
-
-
PepsiCo Reports Third-Quarter 2026 Results (https://www.sec.gov/Archives/edgar/data/77476/000007747626000050/q320268-kxexhibit991.htm) — October 8, 2026; 12 weeks ended September 5; official SEC exhibit read through web tool.
-
-
-
-
-
-



 Transfer