Author: LBank Research Analyst: Ludo
Disclaimer: This report is compiled and analyzed from publicly available information and is intended solely for information sharing and research discussion. It does not constitute investment advice, a securities recommendation, a trading instruction, or any guarantee of returns. The company operations, valuations, market prices, and consensus expectations discussed herein may change over time. Readers should independently verify the data and make their own decisions.
1. Core Conclusion
Overall judgment: Tesla has strong industrial scale, valuable energy and software assets, and ample liquidity, but its valuation already capitalizes a large future autonomy profit pool; the equity risk-reward is negative at the October 23 close, with sustainable FCF after AI investment the decisive variable.
-
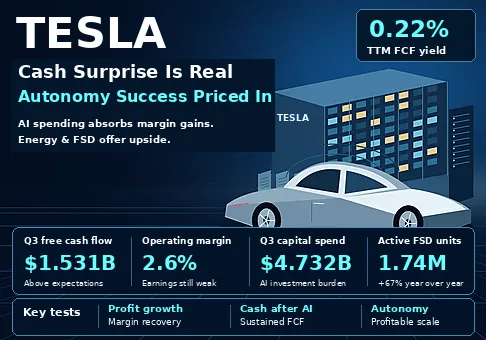
The cash surprise is substantial, but operating earnings did not beat. Q3 FCF of USD 1.531 billion exceeded Tesla's October 19 company-compiled average of negative USD 4.506 billion by USD 6.037 billion. Operating income of USD 718 million was essentially in line with USD 721 million expected. The quarter reduces immediate funding concerns without establishing an earnings acceleration commensurate with the equity valuation.
-
Manufacturing economics improved while spending absorbed the benefit. Gross profit rose USD 440 million YoY to USD 5.494 billion, but operating expenditure rose USD 1.346 billion to USD 4.776 billion. Operating income consequently fell USD 906 million. Automotive gross margin excluding credits reached 18.1%, versus 15.4% a year earlier. Product economics are recovering; the shareholder return depends on how much of that recovery survives the AI and robotics investment cycle.
-
Energy quality is better than its revenue headline. Energy revenue declined 15.6% YoY to USD 2.881 billion while storage deployment increased 9.6% to 13.7 GWh. Energy gross profit of USD 954 million represented 17.4% of group gross profit on only 10.3% of revenue. The margin supports the franchise, but deployment growth alone overstates near-term revenue momentum.
-
The current cash yield leaves a very large execution burden. At USD 372.22 per share, using the 3.9528 billion common shares outstanding reported for October 15, indicative equity value is USD 1.471 trillion. TTM FCF is USD 3.303 billion, a yield of just 0.22%. Simplified EV is about USD 1.435 trillion, or 13.9 times TTM revenue of USD 103.570 billion. Even an illustrative 3% cash yield would require roughly USD 44.1 billion of annual FCF. That is a valuation hurdle, not a forecast or a required near-term payout.
-
Software offers genuine upside, but its measurement and competitive context matter. Active FSD units rose 67% YoY to 1.74 million, including both upfront purchases and monthly subscriptions. Waymo has reached 15 U.S. service cities and closed USD 5 billion of debt financing. Tesla's scale gives it a credible opportunity, but the present valuation requires profitable monetization beyond hardware. Sustained operating margins above 8% and annualized FCF above USD 10 billion after investment would materially weaken this report's negative stance.
The market snapshot uses the latest completed U.S. regular session, October 23, 2026. Equity value uses a current outstanding-share snapshot, rather than weighted-average EPS shares, and includes restricted shares within that reported count. As a sensitivity, using Q3 basic weighted-average shares of 3.240 billion would produce approximately USD 1.206 trillion of equity value and a still-low 0.27% FCF yield. Simplified EV adds USD 9.28 billion of debt principal and subtracts USD 45.447 billion of cash and short-term investments; it excludes operating leases, minority interests and a separate adjustment for the SpaceX equity holding. These conventions are transparent approximations, not a complete sum-of-the-parts valuation.
2. Company Overview, Business Mix, and Core Operating Metrics
Tesla, Inc. sells electric vehicles, energy equipment and related services. It combines vehicle engineering, factories, batteries, software, direct distribution and charging infrastructure. The investment case increasingly depends on turning this industrial base into recurring software and fleet economics. Those economics have to be earned while the manufacturing business continues to fund investment.
Automotive customers pay for vehicles outright, through financing partners or through leases. Software features and subscriptions add revenue to the vehicle relationship; regulatory-credit sales depend on policy and counterparties rather than consumer demand. Revenue recognition therefore differs across deliveries, leases and deferred software obligations. Multiplying total automotive revenue by a delivery growth assumption can obscure these differences.
Energy serves utilities, commercial operators and households through Megapack, Powerwall, solar and associated installation or leasing arrangements. Customers buy usable capacity and system performance, with project acceptance and timing affecting recognized revenue. The business can benefit from grid and data-center power demand, but the whole energy segment is broader than storage cells alone. Services monetizes the growing vehicle base through charging, insurance, parts, repairs and used vehicles. It is useful diversification, although it carries its own labor, claims and inventory costs.
|
Q3 2026 business
|
Products, customers and payment model
|
Revenue, USD million
|
Revenue mix
|
Gross profit, USD million
|
Gross margin
|
Assessment
|
|
Automotive
|
Model 3 / Model Y and other vehicles; consumers and fleets; sales, leases, software and regulatory credits
|
20,560
|
73.3%
|
3,806
|
18.5%
|
Core manufacturing cash engine; pricing and battery availability determine returns
|
|
Energy generation and storage
|
Megapack, Powerwall and solar; utilities, businesses and homes; equipment, installation and leases
|
2,881
|
10.3%
|
954
|
33.1%
|
Highest gross margin, but deployments and revenue diverged
|
|
Services and other
|
Charging, insurance, repairs, parts and used vehicles; transaction and recurring charges
|
4,605
|
16.4%
|
734
|
15.9%
|
Growing installed-base monetization; distinct from an isolated FSD segment
|
|
Total
|
Integrated vehicles, energy and supporting infrastructure
|
28,046
|
100.0%
|
5,494
|
19.6%
|
Gross-profit recovery is being absorbed by operating expenditure
|
Note: Revenue mix and gross margins are calculated from Q3 GAAP revenue and cost of revenue. Gross profit is not segment operating profit: corporate R&D and selling expenses have not been allocated in this table. FSD revenue is embedded within reported categories and is not added again as a fourth revenue segment.
Automotive contributed 69.3% of group gross profit, energy 17.4%, and services 13.4%, with rounding. That distribution is more informative than revenue mix alone. Energy has disproportionate profit importance, while the services business is becoming large enough to influence group economics. However, the automobile business still provides most of the gross-profit pool available to cover shared technology spending.
Core operating metrics and changes
The October 21 results, accompanying shareholder deck and SEC disclosures provide the new evidence for this report. The appropriate expectation benchmark is the company-compiled October 19 analyst average. It is a pre-report sell-side survey published by Tesla, not company guidance, an endorsement by management, or a post-results consensus revision.
|
Metric / event
|
Q3 2026 actual
|
Pre-report average / comparison
|
Interpretation
|
|
Revenue, USD million
|
28,046
|
28,341 consensus; actual -1.0%
|
Flat YoY; energy shortfall offset part of automotive and services strength
|
|
Gross profit, USD million
|
5,494
|
5,061 consensus; actual +8.6%
|
Better product economics than expected
|
|
Operating income, USD million
|
718
|
721 consensus; actual -0.4%
|
Gross-profit upside did not reach operating earnings
|
|
Diluted EPS, USD
|
GAAP 0.22; non-GAAP 0.48
|
GAAP 0.23; non-GAAP 0.45 consensus
|
Adjusted EPS beat 6.7%; GAAP EPS missed 4.3%
|
|
Operating cash flow, USD million
|
6,263
|
3,267 consensus
|
USD 2,996 million above the pre-report average
|
|
Capex cash outflow, USD million
|
4,732
|
7,771 consensus
|
USD 3,039 million lower investment outflow
|
|
FCF, USD million
|
1,531
|
-4,506 consensus
|
USD 6,037 million upside; capital timing is material
|
|
SpaceX relationship
|
Special committee exploring arrangements, potentially a business combination
|
No completed transaction disclosed in the Q3 10-Q
|
Terms, approvals and shareholder economics remain undetermined
|
Note: Financial amounts are USD million except EPS. Consensus contributors differ by metric: revenue and operating income have 23 inputs, operating cash flow and FCF 20, and capex 21. Consequently the average OCF minus average capex differs slightly from average FCF. Actual FCF equals operating cash flow minus cash capex.
Energy revenue missed the survey average by USD 839 million, or 22.6%, while automotive and services revenue exceeded their averages by USD 288 million and USD 256 million. The mix of surprises explains why an adjusted EPS beat alone gives an incomplete reading. Actual gross profit exceeded expectations by USD 433 million, almost entirely offset by USD 436 million of higher operating expenses. This is a spending-conversion problem even after better gross margins.
The cash surprise has two roughly equal components: OCF exceeded the average by USD 2.996 billion and capex was USD 3.039 billion lower. That arithmetic does not establish that capex was permanently cancelled. The 10-Q still expects 2026 capex in excess of USD 20 billion. With USD 13.014 billion spent through September, this implies more than USD 6.986 billion in Q4 if the outlook holds. A quarter of favorable cash timing therefore cannot be mechanically annualized.
Operationally, Tesla delivered 486,532 vehicles, down 2.1% YoY and up 1.3% sequentially. Model 3 / Model Y accounted for 478,237 units, or 98.3% of deliveries. Inventory was 11 days versus 15 in Q2, supporting the view that finished-vehicle inventory is controlled. Battery availability was described by management as a volume constraint; this report treats that as management's assessment, not independently measured unmet demand.
Active FSD units increased from 1.48 million to 1.74 million sequentially. The definition includes upfront purchases, which prevents treating the entire count as monthly recurring subscribers or directly deriving ARR. FSD (Supervised) requires driver supervision. Separately, Tesla reported nearly two million cumulative unsupervised Robotaxi miles and the September introduction of Cybercab into its Austin service. Those milestones demonstrate operational progress; revenue, utilization, insurance cost and intervention economics are the missing financial bridge.
The SpaceX special committee is a material governance event. The 10-Q describes exploration of arrangements that could include a business combination and explicitly gives no assurance of completion. This report assigns no merger premium and assumes no exchange ratio, completion date or synergy. The shares closed 3.08% lower on October 22 and another 0.63% lower on October 23, reaching USD 372.22; those price observations do not isolate the causal effect of any one disclosure.
3. Fundamental Quality
|
Metric
|
Q3 2025
|
Q2 2026
|
Q3 2026
|
Quality assessment
|
|
Revenue, USD million
|
28,095
|
28,236
|
28,046
|
Weak current growth despite 12.5% nine-month growth
|
|
GAAP gross margin
|
18.0%
|
16.8%
|
19.6%
|
Improving mix and product margin
|
|
GAAP operating margin
|
5.8%
|
1.4%
|
2.6%
|
Sequential recovery; material YoY deterioration
|
|
GAAP common net income, USD million
|
1,373
|
1,114
|
787
|
Weak earnings durability
|
|
GAAP diluted EPS, USD
|
0.39
|
0.32
|
0.22
|
Below both comparison quarters
|
|
Operating cash flow, USD million
|
6,238
|
4,697
|
6,263
|
Near-flat YoY; working-capital support matters
|
|
Cash capex, USD million
|
2,248
|
5,789
|
4,732
|
More than doubled YoY
|
|
FCF, USD million
|
3,990
|
-1,092
|
1,531
|
Recovered sequentially; down 61.6% YoY
|
|
Cash and short-term investments, USD million
|
41,647
|
43,524
|
45,447
|
Strong liquidity
|
|
Debt and finance leases, USD million
|
7,702
|
9,342
|
9,523
|
Manageable against liquidity; includes finance leases
|
Note: Cash capex is presented as a positive outflow. Debt and finance leases sum current and non-current balance-sheet carrying amounts. These differ from the USD 9.28 billion debt-principal figure used in simplified EV. FCF is non-GAAP; gross margin, operating margin and EPS in this table are GAAP. All quarterly periods end in September or June as labeled.
Growth and margins are uneven. Nine-month revenue grew 12.5%, but Q3 revenue declined 0.2%. Group gross margin improved 160 basis points YoY, yet R&D increased to USD 2.761 billion from USD 1.630 billion. The key economic question is whether these investments create revenue with attractive incremental margins. Booking more R&D today is evidence of investment, not evidence of a future software return.
Cash conversion needs normalization. Q3 OCF was USD 6.263 billion against USD 804 million of consolidated net income. Depreciation, amortization and impairment added back USD 1.852 billion and stock-based compensation USD 1.165 billion. Accounts payable, accrued and other liabilities supplied USD 3.991 billion; deferred revenue supplied another USD 1.255 billion. Receivables, inventory and prepaid or other assets absorbed cash. Together, the listed working-capital changes contributed approximately USD 2.590 billion. This funding can be commercially sensible, but suppliers and customer prepayments cannot grow ahead of the underlying business indefinitely.
For the first nine months, OCF of USD 14.897 billion less capex of USD 13.014 billion leaves USD 1.883 billion of FCF. TTM FCF is USD 3.303 billion, down from USD 6.834 billion a year earlier. Q3's sequential recovery therefore coexists with a shrinking annual cash return. Stock-based compensation is an OCF add-back, but it remains an economic cost through dilution; adding it back does not make it free shareholder cash.
The balance sheet is strong; allocation discipline is the issue. Cash and short-term investments exceed debt and finance leases by USD 35.924 billion. This provides substantial capacity to fund product development and absorb a difficult quarter. It does not establish that every additional dollar of AI or robotics investment creates value. The USD 2.002 billion SpaceX equity purchase is outside the reported FCF calculation. Acquisition and investment spending must therefore be considered separately when assessing the change in total liquidity.
Our illustrative Q4 base case assumes USD 5.5 billion of OCF and USD 7.25 billion of capex. That produces negative USD 1.75 billion of Q4 FCF and approximately positive USD 0.133 billion for 2026. A stronger cash case of USD 7.0 billion OCF and USD 7.0 billion capex leaves full-year FCF at USD 1.883 billion. A weaker case of USD 4.0 billion OCF and USD 8.0 billion capex produces negative USD 2.117 billion full-year FCF. These are explicitly analyst scenarios, not company guidance, probability-weighted forecasts or a historical model revision. Each remains consistent with capex exceeding USD 20 billion for the year.
A reproducible operating-to-value bridge
Price competition matters even at Tesla's scale. Assume a USD 1,000 reduction in net realized revenue for each of the quarter's 486,532 deliveries, with volume, unit cost, credit revenue and operating expense unchanged. Revenue and gross profit fall by USD 486.532 million; operating income falls from USD 718 million to USD 231.468 million. On reduced group revenue of USD 27.559 billion, operating margin falls to roughly 0.84%.
Assuming a 20% cash tax rate and unchanged working capital and capex, the quarterly FCF reduction is USD 389.226 million. Four identical quarters imply USD 1.557 billion less annual FCF. At an illustrative 3% capitalization yield, that equals about USD 51.9 billion of equity value, or 3.5% of the indicative current capitalization. This is a marginal sensitivity, not a target price: demand elasticity, product mix, tax timing and cost responses would alter the outcome. It demonstrates how modest pricing changes can consume a thin operating-profit base before new autonomy profits arrive.
Fundamental assessment: liquidity and industrial scale are strong; current growth, operating leverage and cash returns after investment are weak. The single most important variable is sustainable incremental FCF from software, services and autonomous fleets after the associated technology and infrastructure spending.
4. Industry and Competitive Landscape
Tesla competes across passenger BEVs, stationary storage, driver assistance and autonomous ride-hailing. These markets have different economics. Vehicle manufacturing depends on utilization, material cost and pricing. Energy projects add deployment and acceptance timing. Software can have attractive incremental margins, while robotaxi fleets add utilization, cleaning, maintenance, depreciation, insurance and local operating constraints. Applying a pure software multiple to every unit of group revenue would ignore those costs.
|
Competitive dimension
|
Tesla evidence
|
Comparable scale / boundary
|
Competitors or alternatives
|
Investment implication
|
|
Passenger BEVs
|
486,532 Q3 deliveries; 98.3% Model 3 / Model Y
|
Global company deliveries, not global market share
|
NIO, Rivian, Lucid and other manufacturers
|
Scale advantage remains; product concentration increases pricing exposure
|
|
Manufacturing capacity
|
Listed Model 3 / Model Y annual capacity exceeds 2.25 million
|
Installed capacity is not output or practical utilization
|
Rivian R2 ramp; NIO multi-brand expansion
|
Tesla can grow without proportional greenfield spending if supply and demand allow
|
|
Energy storage
|
13.7 GWh deployed; USD 954 million gross profit
|
Revenue includes solar and services; deployment timing differs
|
Battery suppliers and storage integrators
|
Attractive profit pool; revenue per GWh cannot be treated as a pure battery price
|
|
FSD and charging ecosystem
|
1.74 million active FSD units; 84,465 Supercharger connectors
|
FSD metric includes upfront purchases and monthly subscriptions; excludes trials
|
Other driver-assistance systems and charging networks
|
Installed-base scale supports monetization, but recurring revenue cannot be inferred directly
|
|
Autonomous ride-hailing
|
Nearly 2 million cumulative unsupervised miles reported
|
Tesla miles and Waymo city count have different denominators
|
Waymo; Lucid / Nuro / Uber program
|
Tesla faces a funded commercial competitor; no monopoly assumption is warranted
|
Note: The capacity subtotal adds the listed California, Shanghai, Berlin and Texas Model 3 / Model Y capacities, excluding Cybertruck and other programs. It is a stated-capacity lower bound, not a sales forecast. No precise global market share is inferred from company delivery numbers or from unlike operational metrics.
The competitive comparison uses Q3 physical volumes where published and Q2 financial results for peers whose Q3 accounts were still pending on October 26. It does not substitute old quarterly revenue for current revenue without labeling it. RMB amounts are retained in original currency because converting them with a current exchange rate would create an unnecessary comparability distortion.
|
Company / business
|
Q3 2026 volume or current scale
|
Latest financial comparator
|
Operating trajectory
|
Competitive conclusion
|
|
Tesla, Inc.
|
486,532 deliveries; 13.7 GWh storage
|
Q3 revenue USD 28.046 billion; group gross margin 19.6%
|
Deliveries -2.1% YoY; positive FCF USD 1.531 billion
|
Scale and funding winner among this EV set; valuation remains demanding
|
|
Rivian Automotive, Inc.
|
19,248 deliveries; 19,751 vehicles produced
|
Q2 revenue USD 1.658 billion; gross profit USD 179 million
|
2026 delivery guidance 65,000–70,000 reaffirmed; Q3 financial results October 29
|
R2 ramp is winning incremental volume; profitability remains less established
|
|
NIO Inc.
|
109,178 deliveries, +25.4% YoY
|
Q2 revenue RMB 32.1369 billion; group gross margin 18.4%
|
Multiple brands expanding; Q3 deliveries +1.4% QoQ
|
Winning volume growth against Tesla in this comparison, with different geography and mix
|
|
Lucid Group, Inc.
|
3,806 deliveries; 2,954 vehicles produced
|
Q2 revenue USD 405 million; total liquidity USD 3.0 billion
|
Production deliberately reduced; Q3 financial results November 9
|
Losing scale momentum while prioritizing cash preservation
|
|
Waymo / Alphabet Inc.
|
15th U.S. service city launched in September
|
USD 5 billion term loan closed October 8; USD 16 billion equity financing earlier in 2026
|
Financing supports geographic expansion; standalone profitability not disclosed here
|
Winning commercial footprint; directly challenges Tesla autonomy economics
|
Note: Comparability is approximate. NIO's vehicle margin of 18.5% in Q2 covers new vehicle sales; Tesla's 18.1% automotive margin excluding credits in Q3 includes a different business mix. Rivian's group gross profit includes software and services. Lucid liquidity includes financing capacity and is not equivalent to Tesla cash and short-term investments. Waymo financing and service-city counts are not revenue or profitability measures.
The identifiable winners are NIO in delivery growth, Rivian in its emerging R2 volume ramp, and Waymo in commercial autonomous footprint. Lucid is losing near-term scale momentum: Q3 production was below both its Q2 output and Q3 deliveries, consistent with its deliberate inventory and cash reset. Tesla remains far larger than these individual EV peers and has a much stronger funding position than a subscale manufacturer. This peer set is an operating comparison, not a comprehensive ranking of the global EV industry.
Tesla's ability to fund several technology programs internally is a real competitive advantage. Services and charging also create an installed-base relationship that smaller manufacturers find difficult to reproduce. However, NIO's faster growth and Rivian's lower-priced product expansion challenge the assumption that Tesla can preserve price while expanding volume. In autonomy, Waymo's access to both equity and debt means Tesla must compete against a well-funded operator rather than merely displace conventional taxis.
Tesla is a net beneficiary of vehicle electrification, storage demand and installed-base monetization, but competitive pressure is a net constraint on its incremental returns. At the current valuation, the latter dominates the equity judgment. The relevant test is whether Tesla captures profitable software and fleet cash flows quickly enough to outgrow the industrial spending burden, while maintaining automotive pricing and energy margins.
5. Key Risks
-
Pricing and demand pressure. If deliveries stagnate and Tesla uses discounts or subsidized financing to maintain utilization, lower net realized revenue feeds directly into gross profit. The USD 1,000 sensitivity shows how quickly thin operating margins can compress. Conversely, higher volume without incentives would weaken this risk assessment.
-
Investment spending reaccelerates before cash earnings. If Q4 capex exceeds USD 6.986 billion as implied by the annual outlook, while OCF falls below USD 6 billion, FCF may turn negative again. New factories, compute and robotics assets can also add future depreciation before utilization becomes sufficient.
-
Working-capital funding reverses. If supplier payments catch up or deferred-revenue inflows slow, the USD 2.590 billion Q3 working-capital contribution can diminish. Cash performance would then deteriorate even without a comparable decline in reported earnings.
-
Autonomy scaling fails to deliver acceptable unit economics. Restrictions, accidents, insurance costs, low utilization or additional human support could raise cost per ride and delay deployment. Supervised FSD adoption cannot automatically be translated into driverless fleet profitability or regulatory approval.
-
Energy deployment outpaces revenue realization. If the Q3 gap persists because of lower-value mix, acceptance timing, pricing or project execution, storage-unit growth will overstate profit growth. A gross margin below 25% would materially reduce the contribution from the highest-margin reported business.
-
SpaceX arrangements change shareholder economics. A proposed transaction with an affiliated company could introduce dilution, transfer-price disputes, approval conditions or capital commitments. No terms are established in this analysis. A favorable, independently supported proposal could also produce upside that this standalone assessment excludes.
-
The negative valuation conclusion is wrong because software scales faster. If monetized FSD adoption, autonomous utilization and services margins deliver recurring FCF far above the present run rate, a current cash-yield framework will understate future value. That is the principal upside risk to this report; a durable margin and FCF inflection would require reassessment.
6. Monitoring Checklist
-
Q4 FCF and capex: assess cash generation against the implied capex floor of USD 6.986 billion. OCF covering that investment with positive FCF would weaken the negative cash-conversion judgment; renewed cash burn would reinforce it.
-
Operating-profit conversion: operating margin above 8% for two consecutive quarters would materially challenge this stance. A margin below 3% despite better automotive gross margin would reinforce it. These are research thresholds, not management targets.
-
Vehicle volume and pricing: track deliveries against the Q3 base of 486,532 and inventory of 11 days. Growth alongside stable net pricing and inventory below 15 days is constructive; discount-led growth with inventory above 20 days is adverse.
-
FSD monetization: track active units against 1.74 million, separating monthly subscriptions, upfront purchases and free trials where disclosed. A count above 2 million is encouraging, but revenue and gross-profit disclosure are needed to demonstrate cash value.
-
Energy conversion: compare deployment above 13.7 GWh with revenue above USD 2.881 billion and gross margin near or above 30%. Deployment growth paired with margin below 25% would weaken the business-quality case.
-
Cash quality: track accounts payable, deferred revenue and capex accruals together. Persistent OCF growth backed by earnings rather than expanding operating liabilities would weaken the normalization concern.
-
Competitive catalysts: review Rivian's October 29 results and Lucid's November 9 results, NIO delivery growth and Waymo service economics. Rival volume growth with improving margins increases pressure on Tesla's price and autonomy assumptions.
-
Governance and durable cash return: require disclosed terms before assigning value to any SpaceX proposal. Annualized FCF above USD 10 billion for two consecutive quarters, after capex and without a major working-capital release, would materially weaken the negative stance.
7. Sources



 Transfer