Author: LBank Research Analyst: Ludo
Disclaimer: This report is compiled and analyzed from publicly available information and is intended solely for information sharing and research discussion. It does not constitute investment advice, a securities recommendation, a trading instruction, or any guarantee of returns. Company operations, valuations, market prices, and expectations may change over time. Readers should independently verify the data and make their own decisions.
1. Core Conclusion
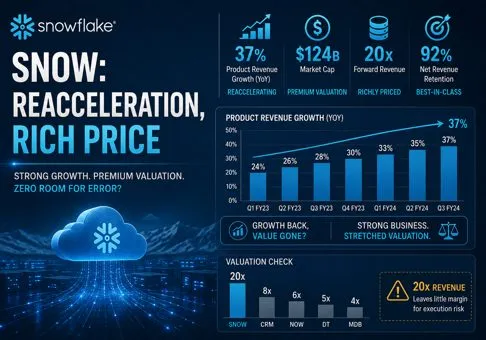
Overall judgment: Snowflake has crossed from deceleration into credible reacceleration, but the September 3 closing market capitalization of approximately USD 123.6 billion values the company at about 20 times management's FY2027 product-revenue guide. The operating evidence supports a premium; it does not yet support an unlimited one. The decisive variable is whether AI workloads can keep product growth in the mid-30% range while GAAP dilution and consumption volatility decline.
-
The reacceleration is broad enough to be operationally meaningful. Q2 FY2027 product revenue reached USD 1.49 billion, up 37% year over year, while total revenue rose 35% to USD 1.55 billion. Management described this as the third consecutive quarter of accelerating product growth. RPO rose 30% to USD 9.00 billion, customers producing more than USD 1 million of trailing product revenue increased 27% to 828, and 692 net customers were added. The implication is that faster growth reflects both larger deployments and a wider customer base rather than one isolated AI product.
-
AI is becoming measurable usage, though it is not yet separately auditable revenue. CoCo exceeded 9,100 accounts, adding more than 2,000 in the quarter, while CoWork reached 5,800 accounts. Snowflake released more than 330 capabilities to general availability in the first half, 35% more than a year earlier. These adoption figures support an AI-driven workload flywheel, but the company does not disclose AI revenue, unit economics, or retention separately. Investors should treat AI as an accelerator within product consumption, not a clean standalone segment.
-
Guidance now embeds momentum rather than mere stabilization. FY2027 product-revenue guidance increased from USD 5.84 billion and 31% growth to USD 6.07 billion and 36% growth. Q3 guidance calls for USD 1.588 billion to USD 1.593 billion, or 37% to 38% growth. Non-GAAP operating-margin guidance also increased 100 basis points to 14.5%, while adjusted free-cash-flow margin remained 23%. Raising both growth and margin is a strong quality signal; the burden now shifts to sustaining those targets after the easiest acceleration comparisons pass.
-
Economic quality is improving faster than GAAP profitability, but equity compensation remains the central reconciliation. Q2 non-GAAP operating margin was 15.3%, while GAAP operating margin remained negative 17.0%. Stock-based-compensation-related charges equaled 29% of revenue, down from 39% a year earlier but still large. Q2 adjusted free cash flow was USD 92 million, only a 6.0% margin because Snowflake's consumption model produces seasonal billings and cash collections. The implication is that non-GAAP leverage is real, yet per-share value creation still depends on reducing dilution and converting accounting adjustments into durable GAAP economics.
-
The post-earnings re-rating leaves little room for a normal consumption wobble. The stock closed at USD 356.47 on September 3, up 16.6% from the pre-results close, implying approximately USD 123.6 billion of equity value and roughly 20.4 times guided FY2027 product revenue. If product growth holds near 35% and non-GAAP operating margin rises toward 20%, that premium can remain defensible. If growth falls below 30%, NRR slips below 120%, or diluted shares exceed management's 380 million guide, valuation compression can overwhelm otherwise good execution.
2. Company Overview, Business Mix, and Core Operating Metrics
Snowflake operates a cloud-native data platform that lets organizations store, process, govern, share, and analyze data across Amazon Web Services, Microsoft Azure, and Google Cloud. Customers purchase capacity and consume credits when workloads run. This model differs from a fixed-seat software subscription: contracted capacity builds backlog and visibility, but reported product revenue responds to actual usage, workload optimization, seasonality, and customer deployment timing.
The platform has expanded from cloud data warehousing into data engineering, data lakes, application development, cybersecurity analytics, collaboration, governance, machine learning, and generative AI. Snowflake's strategic claim is that governed enterprise data should remain in one interoperable environment while multiple compute engines and AI models operate on it. That positioning reduces data movement and can raise consumption as customers add users, queries, models, and applications.
|
Business layer
|
Customer need
|
Monetization
|
Operating evidence
|
Research judgment
|
|
Core data platform
|
Warehousing, engineering, lakes, governance, and secure data sharing
|
Consumption of contracted or on-demand compute, storage, and cloud services
|
Q2 product revenue USD 1.49 billion; 37% growth
|
The economic foundation and clearest evidence of reacceleration
|
|
AI and machine learning
|
Enterprise search, agents, model access, development, and governed inference
|
Incremental platform consumption rather than a separately reported segment
|
CoCo above 9,100 accounts; CoWork 5,800 accounts
|
High-potential workload expansion, but revenue attribution remains opaque
|
|
Applications and collaboration
|
Build, distribute, and share applications and data products without copying data
|
Platform usage plus marketplace and partner-driven consumption
|
More than 330 capabilities made generally available in H1 FY2027
|
Broadens the ecosystem and reinforces switching costs
|
|
Professional services and other
|
Implementation, education, and customer enablement
|
Services revenue, generally lower margin than product revenue
|
Approximately USD 55 million in Q2
|
Strategically useful but economically secondary
|
Snowflake's strongest moat is architectural neutrality combined with governance and data-sharing network effects. It operates across the three major public clouds and therefore presents itself as a control plane above infrastructure vendors. A customer can govern data centrally, make selected data available to business partners, and deploy applications without exporting copies into disconnected systems. That creates workflow, security-policy, and ecosystem switching costs beyond raw database performance.
Its most important weakness is dependence on those same cloud providers. Snowflake buys infrastructure from hyperscalers that also sell competing analytics and AI platforms. Gross margin therefore reflects both product efficiency and negotiated infrastructure economics. Consumption pricing also makes near-term revenue sensitive to customer optimization. The model provides valuable upside when new workloads ramp quickly, but less contractual smoothness than conventional annual recurring revenue.
|
Metric or event
|
Q2 FY2027
|
Year-over-year change
|
Quality of signal
|
Investment implication
|
|
Total revenue
|
USD 1.55 billion
|
35%
|
GAAP reported result
|
Scale is now large enough for acceleration to be strategically significant
|
|
Product revenue
|
USD 1.492 billion
|
37%
|
Primary operating revenue measure
|
Third consecutive acceleration quarter supports a stronger demand regime
|
|
Net revenue retention
|
126%
|
Not disclosed as a change
|
Company-defined trailing consumption metric
|
Existing customers still expand materially, though far below early public-company peaks
|
|
Remaining performance obligations
|
USD 9.00 billion
|
30%
|
Contracted backlog, not a direct revenue forecast
|
Supports medium-term visibility but depends on consumption and contract duration
|
|
Large customers
|
828 above USD 1 million trailing product revenue
|
27%
|
Company-defined customer cohort
|
Enterprise expansion is keeping pace with backlog growth
|
|
Customer additions
|
692 net additions
|
32%
|
Quarterly company disclosure
|
Growth is not solely dependent on existing-account consumption
|
The immediate catalyst is the September 2 earnings release. At the midpoint, Q3 product guidance of USD 1.591 billion implies about 6.6% sequential growth and 37.5% year-over-year growth. The FY2027 guide implies approximately USD 3.07 billion of second-half product revenue after about USD 3.00 billion in the first half. That is achievable if Q3 guidance is met, but it requires Q4 to remain near the current growth rate rather than revert sharply.
The most decision-useful operational bridge is therefore product revenue growth, NRR, and large-customer formation together. Product growth without stable NRR could reflect unusually strong new logos; NRR without customer additions could indicate concentration. Q2 showed balance: expanding consumption, more large customers, and faster net additions. AI adoption is additive evidence, but because Snowflake does not disclose AI revenue, it should not replace those core metrics.
3. Fundamental Quality
|
Item
|
FY2024
|
FY2025
|
FY2026
|
Q2 FY2027
|
Research judgment
|
|
Total revenue
|
USD 2.81 billion
|
USD 3.63 billion
|
USD 4.68 billion
|
USD 1.55 billion
|
Annual growth was about 29% in each of the last two years; current growth has reaccelerated to 35%
|
|
GAAP operating income
|
Negative USD 1.03 billion
|
Negative USD 1.46 billion
|
Negative USD 1.44 billion
|
Negative USD 263 million
|
Loss ratio is improving, but GAAP profitability remains distant
|
|
GAAP net income
|
Negative USD 836 million
|
Negative USD 1.29 billion
|
Negative USD 1.33 billion
|
Negative USD 192 million
|
Interest income helps, but equity compensation keeps reported earnings negative
|
|
Operating cash flow
|
USD 848 million
|
USD 960 million
|
USD 1.22 billion
|
USD 91 million
|
Annual conversion is strong; quarterly seasonality makes one-quarter extrapolation unreliable
|
|
Capital expenditure
|
USD 35 million
|
USD 46 million
|
USD 102 million
|
Approximately USD 8 million
|
Asset-light operations support cash generation, though cloud commitments are economically important
|
|
Cash and convertible debt
|
USD 1.76 billion; none
|
USD 2.63 billion; USD 2.27 billion
|
USD 2.83 billion; USD 2.28 billion
|
Cash and investments about USD 4.3 billion; debt about USD 2.3 billion
|
Net liquidity is ample and refinancing risk is limited
|
Note: Fiscal years end January 31. Capital expenditure uses purchases of property and equipment. Q2 FY2027 cash and investments combines the company's disclosed liquidity categories; it is broader than cash alone. Annual figures are GAAP and rounded.
Growth quality. Snowflake's FY2025 and FY2026 total revenue each grew roughly 29%, a strong rate but one that had ceased to justify the company's earliest hypergrowth valuation. Q2 changes that slope: 37% product growth at more than USD 1.4 billion of quarterly scale is rare. The combination of 126% NRR, 30% RPO growth, and 27% growth in million-dollar customers suggests the acceleration is supported by enterprise usage rather than price alone.
Margins and cash flow. Q2 GAAP product gross margin was 70.9%, while non-GAAP product gross margin was 74.7%. GAAP operating loss narrowed to 17.0% of revenue from materially worse levels historically, and non-GAAP operating margin reached 15.3%. Annual operating cash flow rose from USD 848 million in FY2024 to USD 1.22 billion in FY2026. The gap between cash and GAAP earnings is largely explained by stock compensation, deferred revenue, and working capital. Cash generation is genuine, but stock compensation is an economic cost when it increases the per-share claim count.
Dilution and capital allocation. Stock-based-compensation-related charges equaled 29% of Q2 revenue and roughly USD 424 million of stock compensation was added back in the cash-flow statement. That ratio has improved by about ten percentage points year over year, which is meaningful. However, the USD 456 million broad non-GAAP adjustment for stock-based items in the quarter remains larger than adjusted free cash flow. Management's 380 million diluted-share guide is therefore as important as the 23% adjusted free-cash-flow-margin target. Investors receive per-share value only if cash generation grows faster than the fully diluted share base.
Balance sheet. Snowflake has ample liquidity and a modest net-cash position when marketable investments are included. Approximately USD 2.3 billion of convertible debt does not threaten near-term operations. The more relevant balance-sheet obligations are multi-year cloud-infrastructure commitments, because Snowflake must reserve capacity ahead of consumption. Better utilization expands gross margin; overcommitment during a demand slowdown would reverse that benefit.
Valuation. At USD 356.47 per share and approximately 346.6 million shares outstanding, equity value is about USD 123.6 billion. Dividing by the USD 6.07 billion FY2027 product-revenue guide yields 20.4 times. Using trailing total revenue of USD 5.43 billion produces 22.8 times sales; using trailing free cash flow near USD 1.20 billion produces more than 100 times free cash flow after the September 3 re-rating. These multiples are not automatically excessive for durable 35% growth, but they leave the investment outcome unusually sensitive to small changes in growth duration.
A simple sensitivity illustrates the burden. If product revenue compounds 30% for two years from the FY2027 guide, it reaches about USD 10.3 billion. A future value of 12 times that revenue would be approximately USD 123 billion, close to today's equity value before accounting for net cash or dilution. Meaningful upside therefore requires either growth above 30%, a persistently higher terminal revenue multiple, or substantial incremental cash generation. The market is paying today for several more years of category leadership.
4. Industry and Competitive Landscape
Snowflake competes in a converging market that includes cloud data warehouses, lakehouse platforms, operational databases, observability data, enterprise workflows, and hyperscaler-native analytics. Databricks is the closest architectural competitor but remains private, limiting standardized financial comparison. The public peer set below is therefore a benchmark for growth, margins, enterprise expansion, and AI monetization rather than a claim that each company sells an identical product.
|
Company
|
Latest period
|
Revenue and growth
|
Profitability or cash flow
|
Competitive position
|
Research conclusion
|
|
Snowflake
|
Q2 FY2027
|
USD 1.55 billion total revenue, up 35%; product revenue up 37%
|
15.3% non-GAAP operating margin; 6.0% adjusted free-cash-flow margin
|
Cross-cloud governed data, sharing, and accelerating AI workloads
|
Growth winner and likely net beneficiary, but with the highest execution burden
|
|
MongoDB
|
Q2 FY2027
|
USD 772 million revenue, up 30%; Atlas up 29%
|
24% non-GAAP operating margin; USD 138 million free cash flow
|
Developer-centric operational database across cloud and self-managed environments
|
Margin winner; credible AI-data beneficiary with slower growth than Snowflake
|
|
Datadog
|
Q2 2026
|
USD 1.12 billion revenue, up 36%
|
23% non-GAAP operating margin; USD 279 million free cash flow
|
Observability and security platform for increasingly complex AI and cloud workloads
|
Best public combination of Snowflake-like growth and current cash conversion
|
|
ServiceNow
|
Q2 2026
|
USD 3.99 billion revenue, up 24%; subscription revenue up 24.5%
|
80.5% non-GAAP subscription gross margin
|
Enterprise workflow control plane with AI annual contract value above USD 1 billion
|
Scale and enterprise-distribution winner; less exposed to consumption volatility
|
Note: Fiscal calendars differ. Non-GAAP definitions are company-specific and are not perfectly comparable. Snowflake's adjusted free cash flow is seasonally weak in Q2, while peer figures reflect their respective reporting definitions.
The market's winners are platforms that already control a strategic enterprise layer and can use AI to deepen usage. Snowflake wins when agents and applications generate more governed queries over centralized enterprise data. Datadog wins when AI applications create more infrastructure complexity to observe and secure. ServiceNow wins when enterprises embed AI into workflows, and MongoDB wins when AI applications require operational and retrieval data. These companies can all benefit simultaneously; the competitive battle concerns which platform captures the largest portion of the workload stack.
Snowflake's relative advantage is openness across clouds and a collaboration architecture that lets customers share governed data without moving it. Its relative disadvantage is that Amazon, Microsoft, and Google own the infrastructure underneath and can bundle competing analytics, databases, and AI services. Databricks also competes directly for lakehouse and AI workloads while promoting open formats. If open table standards reduce switching friction, Snowflake must win on governance, ease of use, performance, and ecosystem—not data gravity alone.
Datadog currently has the strongest cash-conversion profile in the public high-growth peer set, while MongoDB showed the sharpest margin improvement, including GAAP operating profitability in its latest quarter. ServiceNow is the scale and distribution leader. Snowflake is the growth winner after its acceleration, and it is a net beneficiary of rising enterprise AI adoption because trusted data is a prerequisite for useful agents. The losers are narrower point solutions that cannot fund rapid product development or integrate governance across workloads. Snowflake will retain winner status only if AI adoption appears in sustained consumption, not merely account counts.
|
Scenario
|
Operating conditions
|
FY2028 product-revenue illustration
|
Indicative revenue multiple
|
Interpretation
|
|
Bull
|
AI workloads sustain 38% growth; NRR stays at least 126%; non-GAAP margin approaches 20%
|
USD 8.38 billion
|
14.8 times current equity value
|
Growth duration begins to justify the premium
|
|
Base
|
Growth moderates to 30%; NRR remains 122% to 125%; margin expands gradually
|
USD 7.89 billion
|
15.7 times current equity value
|
Execution remains excellent, but much of the outcome is already capitalized
|
|
Bear
|
Optimization returns; growth falls to 24%; NRR drops below 120%; margin stalls
|
USD 7.53 billion
|
16.4 times current equity value
|
Multiple compression becomes the dominant equity risk
|
Note: These are mechanical illustrations, not price targets or forecasts. FY2028 product revenue applies the stated one-year growth rate to management's FY2027 guide of USD 6.07 billion. The multiple divides the September 3 equity-value snapshot by the illustrated revenue and excludes future net cash and dilution.
5. Key Risks
-
Consumption growth can reverse faster than contracted backlog suggests. If customers optimize queries, delay migrations, or consume commitments more slowly, product growth can fall even while RPO remains healthy. The transmission path is lower credit consumption, weaker reported revenue, slower gross-profit growth, and compression of a valuation built on sustained mid-30% expansion.
-
AI adoption may not translate into attractive incremental economics. If CoCo and CoWork accounts use low-intensity workloads, rely on subsidized features, or shift spending from existing analytics, account growth will overstate monetization. The trigger is rapid AI-account growth without stable NRR or product-revenue acceleration; the result would be lower confidence in the AI premium.
-
Hyperscalers and Databricks can pressure both share and gross margin. Amazon, Microsoft, and Google control infrastructure, distribution, and competing services, while Databricks competes directly in lakehouse and AI workloads. A trigger would be materially slower large-customer growth or declining product gross margin. The transmission path runs through higher infrastructure costs, more discounts, slower workload wins, and lower long-term margins.
-
Stock compensation can prevent operating progress from becoming per-share value. Stock-based-compensation-related charges were 29% of Q2 revenue. If the ratio remains above 25% or diluted shares exceed 380 million without an offsetting rise in free cash flow per share, dilution will absorb part of operating growth and weaken valuation support.
-
Premium valuation magnifies modest misses. At approximately 20 times guided product revenue and more than 100 times trailing free cash flow, Snowflake does not need a recession to underperform. Product growth below 30%, NRR below 120%, or a guide reduction would lower both expected cash flow and the multiple investors apply, creating a two-part downside mechanism.
-
Cloud-capacity commitments create hidden operating leverage. Snowflake commits to infrastructure purchases in advance. If consumption falls below planned capacity, utilization worsens and product gross margin can decline. A sustained non-GAAP product gross margin below 73% would suggest that capacity economics or competitive pricing has deteriorated.
-
Security, privacy, and governance failures would damage the central trust proposition. Snowflake's moat depends on customers consolidating sensitive enterprise data under its controls. A material breach, account compromise, regulatory sanction, or persistent service outage could trigger remediation costs and workload migration. The deeper effect would be lower win rates for precisely the governed AI workloads expected to drive growth.
-
Acquisition and product velocity can increase execution complexity. More than 330 generally available releases demonstrate speed, but rapid integration can fragment interfaces, support, and sales incentives. If new products raise research and go-to-market costs without lifting consumption, non-GAAP operating margin could stall below management's 14.5% full-year target.
6. Monitoring Checklist
-
Product-revenue growth: Q3 at or above 37% would confirm momentum; below 34% would suggest the acceleration is already fading.
-
Net revenue retention: 124% or higher would indicate durable expansion. Below 120% would materially weaken the consumption thesis.
-
RPO growth: A rate near or above 30% should support medium-term visibility. Growth below 25% would create a bookings-versus-revenue warning.
-
Large customers: Growth in customers above USD 1 million of trailing product revenue should remain above 25%. Below 20% would signal weaker enterprise scaling.
-
AI monetization: CoCo and CoWork adoption should continue rising alongside product revenue. Account growth without stable NRR would be a negative quality signal.
-
Non-GAAP product gross margin: At least 74% would show stable cloud economics. Below 73% would point to pricing, mix, or capacity-utilization pressure.
-
Operating leverage and dilution: Full-year non-GAAP operating margin should meet or exceed 14.5%, stock-based-compensation-related charges should fall toward 25% of revenue, and diluted shares should remain near or below 380 million.
-
Cash conversion: Full-year adjusted free-cash-flow margin near 23% would validate the annual model. A result below 20% without a clear working-capital explanation would weaken fundamental quality.
7. Sources