Author: LBank Research Analyst: Ludo
Disclaimer: This report is compiled and analyzed from publicly available information and is intended solely for information sharing and research discussion. It does not constitute investment advice, a securities recommendation, a trading instruction, or any guarantee of returns. The company operations, valuations, market prices, and consensus expectations discussed herein may change over time. Readers should independently verify the data and make their own decisions.
1. Core Conclusion
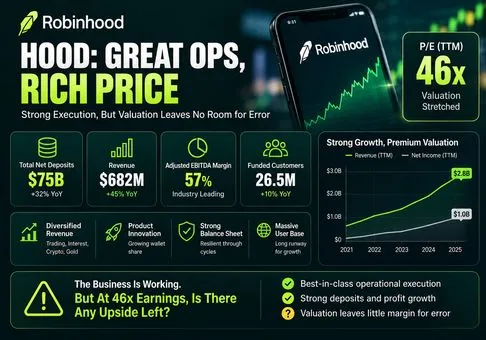
Overall judgment: Robinhood is becoming a high-quality, multi-product financial platform rather than a single-cycle retail broker, but a market capitalization of approximately USD 96.2 billion and roughly 46 times trailing GAAP earnings already price in sustained asset gathering, prediction-market monetization, and operating leverage; the risk-reward bias is therefore negative despite strong execution, with durable revenue per customer as the decisive variable.
-
The operating franchise is stronger than the old “meme broker” label implies. Q2 2026 net revenue rose 32% year over year to a record USD 1.31 billion, Total Platform Assets rose 32% to USD 369 billion, and trailing-twelve-month net deposits reached USD 75.7 billion. Funded Customers increased only 7% to 28.4 million, so most of the economic expansion came from deeper relationships and higher asset density, not merely account creation. That is strategically valuable because assets, margin balances, cash, subscriptions, and trading activity can monetize through several channels.
-
Diversification worked in a weak crypto tape, but event contracts have become a new concentration. Q2 transaction revenue increased 44% to USD 776 million even though crypto revenue fell 38% to USD 100 million. Options revenue rose 29% to USD 342 million, equities revenue rose 95% to USD 129 million, and event-contract revenue exceeded USD 156 million, more than ten times the prior-year level. The mix protects Robinhood from a single crypto cycle, but it transfers part of the earnings debate to the legal durability and take rate of prediction markets.
-
Profitability is real, although headline GAAP growth overstates recurring progress. Adjusted EBITDA increased 35% to USD 741 million and the adjusted EBITDA margin expanded to 57% from 56%. GAAP net income was USD 573 million, but included USD 129 million of gains primarily related to the deconsolidation of Robinhood Ventures Fund I. The cleaner signal is that first-half adjusted EBITDA reached USD 1.28 billion on USD 2.38 billion of revenue, a 54% margin, while adjusted operating expenses plus share-based compensation increased 18% against 24% revenue growth.
-
The valuation requires excellent execution rather than merely good execution. At the September 2 reference market capitalization of about USD 96.2 billion, Robinhood trades at approximately 46 times trailing GAAP net income of USD 2.08 billion and 19.5 times trailing revenue of USD 4.93 billion. Netting USD 5.36 billion of corporate cash against USD 2.17 billion of long-term borrowings produces an indicative enterprise value near USD 93.0 billion, or about 34 times trailing adjusted EBITDA of roughly USD 2.76 billion. These are premium software-like multiples for a regulated broker with activity-sensitive revenue.
-
The thesis breaks positively only if new products raise normalized revenue per customer without matching risk costs. July Funded Customers reached 28.5 million, but crypto volume fell 62% year over year while event contracts rose about twentyfold. Annualizing the Q2 ARPU of USD 187 across 28.5 million customers implies revenue capacity of roughly USD 5.33 billion. Applying the first-half 54% adjusted EBITDA margin produces about USD 2.88 billion of annualized adjusted EBITDA, still more than 33 times the current equity value. A durable ARPU above USD 210 with credit losses contained below 5% of revenue would materially improve the earnings bridge; otherwise, the current multiple leaves insufficient room for normalization.
2. Company Overview, Business Mix, and Core Operating Metrics
Robinhood Markets is a digital financial-services platform focused on self-directed investors. Its core app offers equities, exchange-traded funds, options, retirement accounts, margin lending, cash management, securities lending, cryptocurrency, futures, event contracts, and a paid Robinhood Gold membership. Acquisitions and internal launches have extended the platform into institutional crypto through Bitstamp, registered-investment-adviser infrastructure through TradePMR, Canadian crypto through WonderFi, credit cards, managed portfolios, international stock tokens, and a planned financial blockchain.
The economic model has three principal revenue pools. Transaction-based revenue is earned mainly from routing equity and options orders, crypto transaction fees, and event-contract economics. Net interest revenue comes from customer margin balances, cash and deposits, cash-sweep arrangements, securities lending, and corporate cash. Other revenue includes Gold subscriptions, credit-card and service revenue, and newer programs such as Trump Accounts. The result is an unusually broad retail-finance funnel: low-friction trading attracts customers, Gold and retirement features improve retention, deposits increase the interest base, and new products attempt to lift wallet share.
|
Q2 2026 revenue pool
|
Products and customers
|
Revenue
|
Year-over-year change
|
Share of group revenue
|
Key KPI or economics
|
Research judgment
|
|
Transaction-based
|
Equities, options, crypto, futures, and event contracts for active retail and international users
|
USD 776 million
|
44%
|
59%
|
Options USD 342 million; events USD 156 million; equities USD 129 million; crypto USD 100 million
|
Fastest growth pool, but market activity and regulation make it cyclical
|
|
Net interest
|
Margin lending, customer cash, cash sweep, securities lending, and corporate balances
|
USD 389 million
|
9%
|
30%
|
Margin book USD 21.6 billion; cash and deposits USD 18.7 billion; cash sweep USD 29.7 billion
|
A recurring earnings anchor, offset by rate and credit sensitivity
|
|
Other
|
Gold memberships, credit card, listing and service revenue, and Trump Accounts
|
USD 143 million
|
54%
|
11%
|
Gold subscribers 4.8 million; 17% adoption; about 40% of new funded customers joined Gold
|
Best evidence that Robinhood can monetize beyond trading
|
|
Group total
|
Integrated consumer and institutional financial platform
|
USD 1.31 billion
|
32%
|
100%
|
28.4 million funded customers; USD 369 billion platform assets; USD 187 ARPU
|
Strong product breadth and monetization, with elevated regulatory complexity
|
The most valuable asset is the distribution layer: 28.5 million funded customers as of July 2026, a mobile-first interface, and a brand associated with frequent product launches. The platform turns distribution into economic density. Gold reached 4.8 million subscribers in Q2, retirement assets reached USD 34.5 billion, Robinhood Strategies surpassed 300 thousand funded customers and nearly USD 2 billion of assets under management, and TradePMR reached USD 50 billion of adviser-managed assets. These products lengthen holding periods and make customer economics less dependent on daily trading.
The weakest component is the rising complexity of regulated businesses. Brokerage, crypto custody, credit cards, prediction markets, advice, international tokens, and a blockchain each carry different capital, conduct, technology, and compliance obligations. Robinhood is scaling revenue faster than most retail peers, but it is also expanding the number of failure points. Q2 provision for credit losses doubled to USD 56 million, and the company recorded restructuring and acquisition-related costs while integrating WonderFi, Bitstamp, TradePMR, and Rothera-related activities.
Core Operating Metrics and Changes
The immediate research trigger is the July 29 Q2 2026 earnings release combined with the August 12 July operating update. Q2 showed broad-based revenue growth and record deposits; July then demonstrated that asset gathering remained healthy while trading mix diverged sharply. Equity and options volumes stayed well above the prior year, event contracts remained exceptional, and crypto activity contracted.
|
Metric or event
|
Latest value
|
Comparison
|
Basis
|
Investment implication
|
|
Q2 net revenue
|
USD 1.31 billion
|
32% year over year; 23% sequentially
|
GAAP, quarter ended June 30, 2026
|
Growth was broad enough to offset crypto weakness
|
|
Platform assets and deposits
|
USD 369 billion; USD 21.7 billion Q2 deposits
|
Assets 32% year over year; LTM deposits USD 75.7 billion
|
Company-defined Total Platform Assets and Net Deposits
|
Organic gathering is the clearest durable moat indicator
|
|
Adjusted EBITDA
|
USD 741 million
|
35% year over year; margin 57%
|
Company non-GAAP measure
|
Operating leverage remains positive despite product investment
|
|
GAAP net income and EPS
|
USD 573 million; USD 0.62
|
48% for both headline measures
|
Includes USD 129 million of investment-related gains
|
Recurring growth is lower than the headline result suggests
|
|
July customer metrics
|
28.5 million customers; USD 355 billion assets; USD 5.6 billion deposits
|
Customers 7% and assets 19% year over year
|
Unaudited monthly operating data; assets include Trump Accounts from July
|
Market depreciation reduced assets, but positive deposits continued
|
|
July trading mix
|
Equities USD 333 billion; options 324 million contracts; crypto USD 10.9 billion; events 6.1 billion contracts
|
Year over year: 59%, 66%, negative 62%, and about 20 times
|
Company monthly notional and contract data
|
Prediction markets and options are replacing crypto as the marginal activity driver
|
The next earnings slope depends less on account growth than on monetization per account. The Q2 ARPU of USD 187 was up 24%, materially faster than the 7% increase in funded customers. If customer growth stays in the mid-single digits and ARPU reverts, revenue growth will slow sharply. If Gold, margin, advice, events, and international products sustain ARPU above USD 200, the platform can continue producing double-digit growth even without another surge in retail accounts.
A replicable event-contract bridge illustrates both the upside and the valuation constraint. Q2 event revenue of USD 156 million divided by 13.6 billion contracts equals roughly USD 0.0115 of revenue per contract. July volume of 6.1 billion contracts, sustained for three months, would imply 18.3 billion quarterly contracts and approximately USD 210 million of event revenue at the same yield. That would add roughly USD 54 million of revenue versus Q2 and about USD 31 million of adjusted EBITDA at a 57% margin. The operational gain is meaningful, but small relative to a USD 96.2 billion market capitalization; continued multiple support therefore needs several product engines, not prediction markets alone.
3. Fundamental Quality
|
Item
|
FY2023
|
FY2024
|
FY2025
|
H1 2026
|
Research judgment
|
|
Net revenue
|
USD 1.87 billion
|
USD 2.95 billion
|
USD 4.47 billion
|
USD 2.38 billion
|
Three-year acceleration is exceptional; H1 growth was 24%
|
|
Operating margin
|
Negative 29%
|
36%
|
47%
|
41%
|
Strong structural leverage, with current investment moderating the peak
|
|
GAAP net income
|
Negative USD 541 million
|
USD 1.41 billion
|
USD 1.88 billion
|
USD 919 million
|
Profitable at scale, but 2024 tax benefits and 2026 investment gains reduce comparability
|
|
Adjusted EBITDA
|
USD 536 million
|
USD 1.43 billion
|
USD 2.50 billion
|
USD 1.28 billion
|
The cleanest profitability measure shows sustained scale benefits
|
|
Operating cash flow
|
USD 1.18 billion
|
Negative USD 157 million
|
USD 1.64 billion
|
USD 2.76 billion
|
Not directly comparable with industrial FCF because customer balances and securities lending dominate movements
|
|
Property and capitalized software spending
|
USD 21 million
|
USD 50 million
|
USD 54 million
|
USD 42 million
|
Low physical capital intensity supports high incremental margins
|
|
Cash and long-term borrowings
|
Not shown
|
USD 4.33 billion; no term debt
|
USD 4.26 billion; no term debt
|
USD 5.36 billion; USD 2.17 billion
|
Liquidity is strong, although the June convertible issue introduced dilution and refinancing exposure
|
Note: Operating margin equals net revenue less GAAP operating expenses, divided by net revenue. Property and capitalized software spending is used as a practical capital-expenditure proxy. Brokerage cash flow includes large changes in customer receivables, payables, segregated cash, and securities-lending balances, so nominal operating cash flow less capital expenditure is not an economically clean free-cash-flow measure.
Growth and margins. Revenue has more than doubled from 2023, while the cost base has shifted from fixed platform build-out toward variable brokerage, credit, marketing, and compliance costs. Q2 operating expenses rose 33%, almost matching revenue growth, but the adjusted EBITDA margin still reached 57%. The quality is high because options, interest, subscriptions, and events all contribute; the quality is not software-like because each pool remains exposed to activity, spreads, regulation, or credit.
Cash flow and capital intensity. Robinhood requires little physical capital, but its balance sheet grows with customer activity. First-half 2026 operating cash flow of USD 2.76 billion included major movements in payables to users and securities loaned, while receivables from users and segregated balances consumed cash. Conventional free cash flow therefore overstates or understates economics depending on the period. Adjusted EBITDA, GAAP earnings stripped of identified one-offs, and regulatory capital are more decision-useful than a simple cash-flow yield.
Balance sheet and capital allocation. Cash of USD 5.36 billion exceeded USD 2.17 billion of long-term borrowings, but the June 2026 zero-coupon convertible-note financing creates potential dilution. The company repurchased USD 664 million of Class A stock in H1, including shares bought around USD 94 in Q2, above the approximately USD 47 average price of the broader program since 2024. Repurchases create value only if long-term earnings compound fast enough to justify the rising acquisition price of each share.
Fundamental conclusion. Robinhood's fundamental quality is strong and improving. The single most important variable is durable ARPU: customer growth alone cannot support the current valuation, while ARPU above USD 200 with stable adjusted margins would demonstrate that the Financial SuperApp is becoming an annuity-like earnings platform.
4. Industry and Competitive Landscape
Robinhood competes across overlapping markets rather than one neatly defined industry. In U.S. retail brokerage it faces Schwab, Fidelity, Interactive Brokers, Webull, and mobile products from large banks. In crypto it competes with Coinbase and global exchanges. In options and active trading it competes with specialized platforms; in prediction markets it faces Kalshi, Polymarket, and exchange-backed entrants; in advice and cash products it competes with banks, robo-advisers, and wealth managers. Market-share comparisons are therefore most reliable when expressed through disclosed client assets, accounts, volumes, and revenue rather than a single industry denominator.
|
Competitive dimension
|
Robinhood's verifiable position
|
Scale measure and limitation
|
Main competitors
|
Implication
|
|
Customer acquisition
|
28.5 million funded customers, up 7% year over year in July
|
Funded customers differ from active brokerage or monthly transacting users
|
Schwab, Fidelity, Webull, Coinbase
|
Large mobile distribution remains a genuine moat
|
|
Assets and wallet share
|
USD 355 billion platform assets in July and USD 74.9 billion LTM deposits
|
Includes adviser assets and, from July, Trump Account assets
|
Schwab, Interactive Brokers, traditional banks
|
Fast inflows matter more than current absolute scale
|
|
Active trading
|
July equities USD 333 billion and options 324 million contracts
|
Notional and contract counts do not translate directly into revenue share
|
Interactive Brokers, Schwab, Webull
|
Robinhood is winning engagement among mobile-first retail traders
|
|
Crypto and event markets
|
July crypto volume USD 10.9 billion; event contracts 6.1 billion
|
Crypto includes acquired platforms; event-contract unit economics are product-specific
|
Coinbase, Kalshi, Polymarket, global exchanges
|
Events offset crypto cyclicality but increase legal and political exposure
|
|
Recurring monetization
|
4.8 million Gold subscribers and USD 69.4 billion of selected interest-earning assets in July
|
Gold revenue is included in other revenue; asset balances have different spreads
|
Schwab, banks, subscription fintechs
|
This is the bridge from trading app to diversified financial institution
|
|
Company
|
Latest comparable period
|
Revenue and asset scale
|
Growth and profitability
|
Operating position
|
Competitive conclusion
|
|
Robinhood
|
Q2 2026
|
USD 1.31 billion revenue; USD 369 billion platform assets
|
Revenue up 32%; adjusted EBITDA margin 57%; funded customers up 7%
|
Fast product launches, strong deposits, rapidly expanding events and margin balances
|
Net winner in next-generation retail engagement, but priced for dominance
|
|
Interactive Brokers
|
Q2 2026
|
USD 1.90 billion net revenue; USD 930 billion customer equity
|
Revenue up 28%; pretax margin 77%; accounts up 34%
|
Superior automation, global market access, and professional-trader economics
|
Winner on profitability and international trading depth
|
|
Charles Schwab
|
Q2 2026
|
USD 7.07 billion net revenue; USD 13.08 trillion client assets
|
Revenue up 21%; net income up 32%; active accounts up 6%
|
Unmatched asset scale, advice ecosystem, banking, and customer trust
|
Winner in wealth consolidation; slower product velocity than Robinhood
|
|
Coinbase
|
Q2 2026
|
About USD 1.2 billion net revenue; USD 246 billion assets on platform
|
Net revenue down from USD 1.4 billion; net loss USD 360 million; MTUs 7.6 million
|
Deep crypto infrastructure and institutional capabilities, but heavy cycle exposure
|
Near-term loser on earnings resilience, despite stronger pure-crypto depth
|
Note: Peer periods are the quarter ended June 30, 2026. Asset and user definitions differ materially. Schwab reports client assets and active brokerage accounts; Interactive Brokers reports customer equity and total accounts; Coinbase reports Assets on Platform and Monthly Transacting Users; Robinhood reports Total Platform Assets and Funded Customers. These metrics are directional, not directly interchangeable.
Robinhood and Interactive Brokers are the clearest operating winners. Robinhood is winning younger retail wallet share and product engagement; Interactive Brokers is winning global accounts while sustaining a 77% pretax margin. Schwab remains the structural scale leader and a formidable destination for larger, advice-oriented balances. Coinbase is the near-term loser because crypto price and activity weakness drove lower users, assets, revenue, and negative GAAP earnings, even as its derivatives and infrastructure breadth improved.
Robinhood is a net beneficiary of the convergence between brokerage, crypto, payments, advice, and event markets. Its advantage is not the lowest cost or the deepest professional toolkit; it is the ability to distribute many products through one high-engagement consumer interface. Its disadvantage is that the market capitalizes that optionality before the economics are fully seasoned. IBKR's higher margin and Schwab's vastly larger asset base demonstrate that Robinhood still has substantial execution ahead before its premium can be treated as self-evident.
5. Key Risks
-
Prediction-market regulation could remove the fastest incremental revenue pool. If federal or state action restricts event contracts, or if product structure changes reduce monetization, the Q2 USD 156 million revenue contribution could contract quickly. That would reduce transaction growth, compress incremental margins, and undermine the Financial SuperApp narrative supporting the premium multiple.
-
Retail activity may normalize faster than customer assets grow. July crypto volume fell 62% year over year and equities volume declined 15% sequentially. A simultaneous decline in options and event activity would hit transaction revenue immediately, while marketing and technology spending would adjust more slowly, driving negative operating leverage.
-
Interest-rate and balance-mix shifts can weaken recurring revenue. Net interest revenue is exposed to margin demand, customer cash allocation, securities-lending availability, and the spread Robinhood retains after customer yields. A 100-basis-point adverse rate move was estimated in the 2025 10-K to affect annual pre-tax revenue and cash flow by roughly USD 304 million using period-end balances. Balance growth can offset part of the pressure, but not eliminate it.
-
Credit expansion creates losses that the trading-era model did not carry. Q2 provision for credit losses doubled to USD 56 million as credit-card and margin exposure expanded. If provisions exceed 5% of revenue for multiple quarters, the benefit from higher interest and card revenue would be materially less valuable, and investors would likely apply a lower financial-services multiple.
-
Acquisition and product complexity can overwhelm controls. Bitstamp, TradePMR, WonderFi, Rothera, advisory products, international tokens, Trump Accounts, credit cards, and Robinhood Chain span multiple regulatory regimes and technology stacks. A material custody, clearing, cybersecurity, best-execution, or compliance failure could trigger penalties, customer outflows, remediation spending, and a durable trust discount.
-
Valuation compression can dominate good fundamentals. Approximately 46 times trailing earnings and about 34 times indicative trailing adjusted EBITDA leave little tolerance for revenue growth below 20%, ARPU below USD 180, or adjusted EBITDA margins below 50%. Even continued absolute earnings growth could produce weak equity returns if the market re-rates Robinhood toward established broker multiples.
-
Convertible financing and equity compensation may dilute per-share value. Robinhood issued USD 2.2 billion of zero-coupon convertible notes in June 2026 and recorded USD 197 million of share-based compensation in H1. Capped calls mitigate some dilution, but rapid hiring, acquisitions, and a high share price can keep fully diluted share growth above repurchase offsets.
6. Monitoring Checklist
-
Net deposits: LTM growth above 20% of beginning platform assets would support the wallet-share thesis; below 15% for two quarters would weaken it.
-
ARPU: Sustained ARPU above USD 200 would validate multi-product monetization. A decline below USD 175 would signal that asset growth is not translating into revenue density.
-
Adjusted EBITDA margin: A range above 54% while revenue grows more than 20% would strengthen the quality assessment; below 50% would indicate that product complexity is absorbing operating leverage.
-
Event contracts: Quarterly volume above 18 billion contracts with stable revenue per contract would support the new growth engine. Regulatory suspension or a monetization decline greater than 25% would invalidate the extrapolation.
-
Crypto mix: Stabilization of Robinhood App crypto volume after July's 74% year-over-year decline would reduce downside risk; continued declines combined with weaker options activity would expose transaction concentration.
-
Credit losses: Provision below 5% of net revenue is manageable. A sustained ratio above that level would suggest that card and margin growth is being purchased with deteriorating underwriting economics.
-
Gold and recurring products: Gold adoption above 18%, continued retirement-asset growth above 25%, and positive Strategies inflows would demonstrate deeper household relationships.
-
Competitive read-through: Track IBKR account growth and pretax margin, Schwab core net new assets, and Coinbase users and assets. Robinhood must continue growing deposits faster than mature brokers without sacrificing margin or controls.
7. Sources