Author: LBank Research Analyst: Ludo
Disclaimer: This report is compiled and analyzed from publicly available information and is intended solely for information sharing and research discussion. It does not constitute investment advice, a securities recommendation, a trading instruction, or any guarantee of returns. The company operations, valuations, market prices, and consensus expectations discussed herein may change over time. Readers should independently verify the data and make their own decisions.
1. Core Conclusion
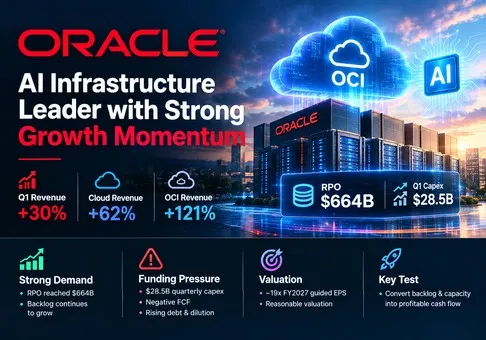
Overall view: Oracle is now a high-growth AI infrastructure company attached to a durable database and applications franchise, and the equity looks reasonably valued with a positive risk-reward bias after the reset to roughly 19 times FY2027 guided non-GAAP EPS. The decisive variable is not demand—Q1 FY2027 OCI revenue grew 121%—but whether customer funding, utilization, and operating profit can catch up with a capital program that required USD 28.5 billion of quarterly capex and USD 20 billion of new common equity.
-
The cloud acceleration is real and economically large. Q1 revenue rose 30% to USD 19.35 billion, cloud revenue grew 62% to USD 11.61 billion, and OCI revenue advanced 121% to USD 7.39 billion. Oracle delivered 850MW of additional datacenter capacity and more than 300,000 GPUs during the quarter. OCI added USD 4.04 billion of year-over-year revenue—more than the entire prior-year quarterly OCI base added again—so Oracle is no longer merely promising an AI-cloud transition. This scale supports a higher growth multiple than the legacy database business earned.
-
Backlog is extraordinary, but its quality matters more than its headline size. RPO reached USD 664 billion, up USD 209 billion year over year, after more than USD 30 billion of new AI cloud contracts were booked in Q1. The backlog is 9.9 times FY2026 revenue, yet revenue recognition depends on datacenter delivery, customer readiness, contract duration, and customer credit. The investment implication is that supply execution and contract economics, rather than new-logo demand, now determine the slope of revenue and returns.
-
Reported cash flow overstates self-funded economics. Operating cash flow reached USD 23.10 billion, but USD 11.36 billion came from customer prepayments with a significant financing component. Capex was USD 28.50 billion, producing reported FCF of negative USD 5.40 billion. Removing that financing-like prepayment leaves approximately USD 11.74 billion of underlying operating cash flow and negative USD 16.76 billion of cash flow after capex. Oracle’s supplemental net cash outlay for capex was USD 17.97 billion after customer prepayments and short-term financing. Growth is funded more intelligently than the headline capex suggests, but it is not yet organically self-funding.
-
Valuation has reset to a level that compensates for execution risk, but leverage prevents calling the stock plainly cheap. Using the September 10 after-hours reference of USD 153.50 and Q1 diluted shares of 3.00 billion implies equity value near USD 460.5 billion. Adding roughly USD 88.3 billion of net debt gives enterprise value near USD 548.8 billion, or about 6.1 times management’s minimum FY2027 revenue target of USD 90 billion. The same price is about 19.0 times FY2027 guided non-GAAP EPS of USD 8.10. That is attractive for 30%-plus near-term revenue growth, but only if depreciation, interest, and dilution do not absorb the operating upside.
-
The positive thesis has clear falsification points. It strengthens if Q2 revenue growth lands at or above the 32% midpoint, cloud growth reaches at least the 68% midpoint, GAAP operating margin stays above 33%, and net cash outlay for capex falls below reported capex as customer funding expands. It weakens if OCI growth falls below 100% before capacity constraints ease, RPO growth stalls without faster conversion, diluted shares rise above 3.1 billion, or quarterly net cash outlay remains above USD 20 billion. Oracle must turn capacity into profitable utilization before capital markets become the permanent business model.
The operating-to-valuation chain is reproducible. Q1 OCI revenue increased by USD 4.04 billion year over year, while total cloud revenue increased by USD 4.42 billion and GAAP operating income increased by USD 2.45 billion. For Q2, the midpoint of total-revenue guidance implies about USD 21.20 billion, calculated as Q2 FY2026 revenue of USD 16.06 billion multiplied by 1.32. The midpoint of cloud guidance implies about USD 13.40 billion, calculated as USD 7.98 billion multiplied by 1.68. Holding Q1’s 34.8% GAAP operating margin would yield roughly USD 7.38 billion of quarterly operating income. At an enterprise value near USD 548.8 billion, the market pays about 6.1 times minimum guided FY2027 revenue; the rerating case therefore requires growth conversion into cash, not a higher backlog headline.
2. Company Overview, Business Mix, and Core Operating Metrics
Oracle sells mission-critical database technology, enterprise applications, and cloud infrastructure. Its software support base and installed database estate provide recurring cash generation and privileged access to enterprise data. Fusion Cloud ERP, NetSuite, HCM, and industry applications are sold primarily through subscriptions. OCI sells compute, storage, networking, database, GPU clusters, and AI training and inference capacity through consumption and committed contracts. Hardware includes engineered systems and servers, while Services covers consulting and customer support work that helps deploy Oracle products.
The commercial model is shifting rapidly. Cloud represented 60% of Q1 revenue, up from 48% a year earlier, while software fell from 38% to 29%. Cloud applications provide steadier subscription economics; OCI is the capital-intensive growth engine. Software support remains highly profitable and helps finance the transition, although migration pressures license and support revenue.
|
Business
|
Q1 FY2027 revenue
|
YoY growth
|
Mix
|
Products, customers, and economics
|
Research view
|
|
Cloud
|
USD 11.61 billion
|
62%
|
60%
|
OCI plus Fusion, NetSuite, HCM, database, and industry SaaS; consumption and subscription contracts.
|
The dominant growth and valuation driver; OCI scale is rising faster than the application layer.
|
|
Software
|
USD 5.55 billion
|
negative 3%
|
29%
|
On-premises licenses and support for database, middleware, and applications.
|
A durable installed-base cash pool, but migration makes reported growth structurally negative.
|
|
Hardware
|
USD 0.77 billion
|
15%
|
4%
|
Engineered systems, servers, storage, and related support sold to enterprises and governments.
|
Small, strategically useful for integrated systems, and not central to the valuation case.
|
|
Services
|
USD 1.41 billion
|
5%
|
7%
|
Consulting, implementation, education, and advanced customer support.
|
Supports adoption but carries lower scalability than subscription and consumption revenue.
|
|
Oracle total
|
USD 19.35 billion
|
30%
|
100%
|
Integrated applications, database, and infrastructure stack.
|
Business quality is improving as OCI expands, but capital intensity is also resetting upward.
|
Note: Revenue mix is calculated from company-reported GAAP revenue and may not sum perfectly due to rounding. Cloud combines IaaS and SaaS.
Within cloud, the distinction between applications and infrastructure is crucial. Q1 cloud applications revenue was USD 4.22 billion, up 10%, while OCI revenue was USD 7.39 billion, up 121%. OCI therefore represented about 64% of cloud revenue versus 47% a year earlier. Oracle’s database presence is an advantage because customers can place databases close to applications and AI models, including through multicloud arrangements. The constraint has shifted from demand generation to powered-shell delivery, GPU availability, commissioning speed, and workload utilization.
The legacy software decline is not automatically value destruction. A customer moving from an on-premises license to Oracle Cloud can reduce software revenue before creating a longer cloud stream. However, cloud cost rose 77% against 62% cloud revenue growth, showing that the new mix is not yet producing mature hyperscale economics. Sales and marketing expense fell 12%, R&D fell 4%, and restructuring expense fell 77%, allowing group GAAP operating margin to expand to 34.8%. This operating leverage partly offsets infrastructure build costs that will appear later through depreciation and interest.
Core Operating Metrics and Changes
The immediate trigger is Oracle’s Q1 FY2027 release on September 10. It confirmed triple-digit OCI growth and capacity delivery, raised full-year non-GAAP EPS guidance to USD 8.10, and maintained at least USD 90 billion of revenue. The quarter also completed a USD 20 billion ATM common-stock program. This is the central conflict: growth and margins beat the legacy profile, while shareholders directly funded the capacity required to deliver it.
|
Metric / event
|
Latest value
|
Comparison
|
Basis
|
Investment meaning
|
|
Q1 revenue
|
USD 19.35 billion
|
up 30% YoY
|
GAAP; quarter ended August 31, 2026
|
Growth accelerated from FY2026’s 17% rate and validates the capacity ramp.
|
|
OCI revenue
|
USD 7.39 billion
|
up 121% YoY
|
Company IaaS definition
|
Oracle is gaining cloud scale rapidly from a smaller base than hyperscale peers.
|
|
RPO
|
USD 664 billion
|
up USD 209 billion YoY
|
Contracted performance obligations
|
Demand visibility is exceptional; conversion timing and customer quality are the real risks.
|
|
Capacity delivery
|
850MW and over 300,000 GPUs
|
GPU delivery nearly 3x Q4 FY2026
|
Company operating disclosure
|
Physical delivery explains revenue acceleration and raises utilization execution risk.
|
|
GAAP / non-GAAP operating margin
|
34.8% / 42.1%
|
up 6.1 points / broadly flat
|
Non-GAAP excludes SBC, amortization, and restructuring
|
Expense discipline protected earnings, but mature cloud margin expansion is not yet proven.
|
|
OCF / capex / FCF
|
USD 23.10 / 28.50 / negative 5.40 billion
|
OCF up 184%; capex up 235%
|
Company GAAP OCF and capex; company FCF definition
|
Customer prepayments support liquidity, but cash returns still lag accounting profit.
|
|
Q2 / FY2027 guidance
|
30%–34% revenue growth; USD 8.10 FY EPS
|
65%–71% cloud growth in USD
|
Company forward guidance; non-GAAP EPS
|
A high growth floor supports valuation, while execution must absorb rising depreciation and financing costs.
|
Note: FCF equals operating cash flow less capex. The 235% capex growth is calculated from USD 28.50 billion versus USD 8.50 billion. Percentage-point changes are rounded.
Q1’s earnings quality is mixed rather than weak. GAAP operating income grew 57% to USD 6.73 billion and GAAP net income grew 63% to USD 4.76 billion. Interest expense nevertheless increased 55% to USD 1.43 billion, already consuming 21% of operating income. Weighted diluted shares increased 3% to 3.00 billion. The growth engine is outpacing these headwinds today, but the capital structure is becoming part of the product economics.
Guidance implies another acceleration in absolute dollars. At the midpoint, Q2 total revenue would rise about USD 5.14 billion year over year and cloud revenue about USD 5.42 billion. The difference suggests non-cloud revenue remains roughly flat to down, making OCI the main source of incremental earnings. If cloud revenue grows without maintaining at least the low-30s group GAAP operating margin, the market will infer that Oracle won contracts by accepting weaker long-run returns.
3. Fundamental Quality
|
Metric
|
FY2024
|
FY2025
|
FY2026
|
Q1 FY2027
|
Research view
|
|
Revenue
|
USD 52.96 billion
|
USD 57.40 billion
|
USD 67.36 billion
|
USD 19.35 billion
|
Growth accelerated from 8% to 17% to 30% as OCI capacity came online.
|
|
GAAP operating income / margin
|
USD 15.35 billion / 29.0%
|
USD 17.68 billion / 30.8%
|
USD 20.61 billion / 30.6%
|
USD 6.73 billion / 34.8%
|
Current operating leverage is strong; future depreciation is the key margin test.
|
|
GAAP net income
|
USD 10.47 billion
|
USD 12.44 billion
|
USD 17.09 billion
|
USD 4.76 billion
|
Profit growth is strong, though FY2026 included non-operating gains.
|
|
Operating cash flow
|
USD 18.67 billion
|
USD 20.82 billion
|
USD 31.98 billion
|
USD 23.10 billion
|
Q1 was boosted by USD 11.36 billion of financing-like customer prepayments.
|
|
Capex / FCF
|
USD 6.87 / 11.81 billion
|
USD 21.22 / negative 0.39 billion
|
USD 55.66 / negative 23.69 billion
|
USD 28.50 / negative 5.40 billion
|
Cash conversion collapsed as AI infrastructure expanded faster than operating cash generation.
|
|
Cash plus securities / debt
|
Not shown
|
Not shown
|
USD 31.89 / 129.54 billion
|
USD 37.08 / 125.34 billion
|
Net debt improved sequentially after equity funding but remains substantial.
|
|
Diluted EPS
|
USD 3.71
|
USD 4.34
|
USD 5.83
|
USD 1.56
|
Earnings are compounding, but a larger share base reduces per-share capture.
|
Note: Annual figures are GAAP and use fiscal years ended May 31. FCF equals operating cash flow less capex. FY2026 debt combines current and non-current borrowings; Q1 FY2027 uses the same definition. Q1 values are quarterly and not annualized.
Growth and margins. Oracle’s fundamental quality has improved because growth now comes from a large, contracted infrastructure business rather than financial engineering. Cloud became 60% of revenue, and the USD 4.04 billion OCI year-over-year increment was accompanied by a USD 2.45 billion increase in GAAP operating income. Sales and marketing plus R&D fell by USD 342 million despite 30% revenue growth, demonstrating operating leverage in the legacy organization. The caution is timing: capex affects cash immediately, while depreciation reaches the income statement as assets enter service. Q1 depreciation more than doubled to USD 3.16 billion, and further capacity delivery will keep that expense rising.
Cash flow and capital expenditure. Reported OCF was 4.85 times GAAP net income, which would normally signal superb conversion. Here the ratio is misleading because customer prepayments with a financing component contributed USD 11.36 billion. Excluding them, OCF was approximately USD 11.74 billion, still healthy but far below capex. Oracle’s net cash outlay measure reduces capex by customer funding and short-term financing to USD 17.97 billion; that is the cleaner liquidity measure, but it does not remove the obligation to deliver future service against the prepayment. The economics improve only when utilization and gross profit amortize the infrastructure cost over contract lives.
Balance sheet and capital allocation. Cash and marketable securities rose to USD 37.08 billion, while debt fell modestly to USD 125.34 billion, leaving roughly USD 88.26 billion of net debt. The ATM added USD 19.91 billion net cash, while Oracle repaid USD 4.20 billion of borrowings and paid USD 1.57 billion of dividends. This was rational funding for a contracted capacity ramp, yet it transferred part of the project risk to common shareholders. The quarterly diluted share count rose 3%, and preferred dividends appeared after Oracle’s mandatory convertible financing. Capital allocation is acceptable only if the capacity earns returns above the cost of debt and dilution.
Fundamental conclusion. Oracle is financially strong at the operating level but only medium quality on cash conversion. The installed software base, accelerating cloud revenue, and expanding GAAP margin support the business. The negative FCF, USD 88 billion-plus net debt, and equity issuance prevent treating accounting growth as fully captured shareholder value. The single most important variable is cash capex net of customer funding relative to incremental OCI gross profit.
4. Industry and Competitive Landscape
Oracle competes across hyperscale cloud infrastructure, enterprise database, SaaS applications, and implementation ecosystems. There is no single audited market-share denominator that cleanly combines these layers. Cloud-company growth rates also differ because Microsoft includes Azure services, Alphabet combines GCP and Workspace in Google Cloud, and Oracle separates OCI from cloud applications. This report therefore compares revenue scale, growth, margins, backlog, and capital intensity as operating proxies rather than asserting a precise market share.
|
Competitive dimension
|
Oracle's verifiable position
|
Scale proxy and limitation
|
Main competitors / substitutes
|
Growth and valuation implication
|
|
AI infrastructure
|
OCI delivered 850MW and over 300,000 GPUs in Q1; demand continues to exceed supply.
|
USD 7.39 billion quarterly OCI revenue; smaller than leading hyperscalers and not a market-share figure.
|
AWS, Microsoft Azure, Google Cloud, CoreWeave, and customer-owned clusters.
|
Fastest disclosed growth supports share gains, but scale and funding remain weaker than Big Tech peers.
|
|
Database and data platform
|
Large installed base, mission-critical workloads, Autonomous Database, and multicloud database services.
|
Software support was USD 19.80 billion in FY2026; it includes more than database alone.
|
Microsoft, AWS, Google, IBM, SAP, Snowflake, Databricks, and open-source databases.
|
Installed data creates switching costs and workload pull-through into OCI.
|
|
Enterprise applications
|
Fusion, NetSuite, HCM, supply-chain, and industry applications form a broad SaaS suite.
|
USD 4.22 billion quarterly cloud applications revenue; category margins are not separately disclosed.
|
SAP, Microsoft, Salesforce, Workday, ServiceNow, and specialist SaaS vendors.
|
Ten-percent growth is durable but no longer the primary rerating engine.
|
|
Backlog and contracted demand
|
RPO of USD 664 billion includes large AI contracts and customer-funded equipment structures.
|
RPO spans different durations and is not directly comparable with cloud backlog at peers.
|
Microsoft commercial RPO of USD 678 billion and Google Cloud backlog above USD 500 billion.
|
Oracle has comparable headline visibility despite much lower current revenue, increasing both upside and concentration risk.
|
|
Capital access
|
Customer prepayments, debt, mandatory convertibles, and a completed USD 20 billion ATM fund expansion.
|
Q1 net cash outlay for capex was USD 17.97 billion after financing offsets.
|
Big Tech peers fund AI investment from larger diversified cash engines.
|
Oracle can compete on capacity, but its higher funding cost deserves a valuation discount.
|
|
Company / platform
|
Latest period
|
Revenue / KPI
|
Growth / margin
|
Capital and backlog context
|
Competitive conclusion
|
|
Oracle
|
Q1 FY2027
|
USD 7.39 billion OCI; USD 664 billion RPO
|
121% OCI growth; 34.8% group GAAP operating margin
|
USD 28.50 billion capex; USD 11.36 billion customer prepayments; USD 20 billion ATM.
|
Fastest grower and a net share gainer, but the most visibly financing-dependent.
|
|
Microsoft Azure
|
Q4 FY2026
|
Azure exceeded USD 100 billion FY revenue; USD 678 billion commercial RPO
|
43% Azure growth; 45.1% group GAAP operating margin
|
Q4 company capex was about USD 41 billion; diversified software cash flow funds investment.
|
Scale and enterprise distribution leader; winning while preserving superior funding capacity.
|
|
AWS
|
Q2 2026
|
USD 42.23 billion revenue; USD 16.62 billion operating income
|
37% growth; 39.4% segment operating margin
|
Amazon expects about USD 220 billion of 2026 cash capex across AI and other investments.
|
Revenue and profit-pool leader; Oracle is gaining faster but remains far smaller.
|
|
Google Cloud
|
Q2 2026
|
USD 24.77 billion revenue; USD 8.81 billion operating income
|
82% growth; 35.6% segment operating margin
|
Cloud backlog was above USD 500 billion; Alphabet also raised substantial equity and debt for AI infrastructure.
|
Strongest combination of hyperscale growth and reported segment profitability.
|
|
IBM
|
Q2 2026
|
USD 7.76 billion software revenue; USD 17.2 billion total revenue
|
5% software growth; 32.2% software segment margin
|
Hybrid Cloud revenue grew 11%; full-year FCF is expected to rise by about USD 1 billion.
|
Cash-generative enterprise incumbent, but losing growth relevance versus hyperscale AI platforms.
|
Note: Periods and definitions differ. Azure revenue growth excludes a directly disclosed quarterly revenue amount; Microsoft commercial RPO covers more than Azure. Google Cloud includes Workspace. Oracle RPO covers cloud and other contracts. AWS margin equals operating income divided by segment sales. Capital figures have different scopes and are approximate where companies use broader definitions.
Google Cloud is the clearest current winner because it combined 82% growth with a 35.6% segment operating margin at more than three times Oracle’s quarterly OCI revenue. Microsoft remains the enterprise distribution and balance-sheet leader, while AWS retains the largest reported cloud revenue and profit pool. Oracle is nevertheless gaining: 121% OCI growth, an 850MW quarterly capacity addition, and RPO nearly equal to Microsoft’s commercial RPO are evidence that it has become a credible fourth hyperscale platform rather than a niche database host.
Oracle’s differentiation is workload location and economics. Its database estate, low-latency clusters, bare-metal architecture, and multicloud database presence can win AI training, inference, and data-adjacent workloads that do not need a single-vendor software stack. Its disadvantage is capital structure. Microsoft, Amazon, and Alphabet can fund infrastructure with advertising, commerce, productivity, and existing cloud cash flows. Oracle must rely more heavily on prepayments and external capital, so identical revenue growth creates less near-term per-share value.
IBM is the relative loser in this comparison. Its software revenue grew 5% and Hybrid Cloud grew 11%, respectable for a mature franchise but far behind hyperscale AI demand. Oracle is a net beneficiary of the current industry shift because infrastructure growth overwhelms legacy software decline. It will remain a net beneficiary only if capacity utilization produces competitive gross profit before depreciation and financing costs catch up.
5. Key Risks
-
Customer and contract concentration. If one or more large AI customers delays deployment, renegotiates capacity, or experiences financing stress, RPO conversion could slow while Oracle remains committed to datacenters and equipment. Revenue would miss guidance, utilization would fall, and depreciation and interest would pressure margins.
-
Capital intensity and negative FCF. If quarterly reported capex remains near USD 28.5 billion without comparable customer funding, Oracle would require additional debt or equity. Higher interest expense and dilution would absorb per-share earnings even if OCI revenue keeps growing.
-
Prepayment quality. Customer prepayments improved OCF by USD 11.36 billion, but they are financing tied to future service. If contract economics are weak or delivery costs rise, cash received upfront could mask a low-return obligation rather than improve lifetime profitability.
-
Capacity execution. Power, permits, networking, construction, accelerator supply, and commissioning can delay revenue. A quarterly capacity addition materially below 850MW while demand remains strong would push RPO conversion outward and weaken the FY2027 revenue path.
-
Hyperscaler competition and pricing. AWS, Azure, Google Cloud, and specialized GPU clouds can lower prices, bundle models, or use custom silicon to reduce cost. If Oracle’s OCI growth falls below 100% before its scale economics improve, the market may conclude that growth was contract-specific rather than durable share gain.
-
Margin lag from depreciation and interest. Q1 depreciation rose 134% and interest expense rose 55%. If GAAP operating margin falls below 33% or interest exceeds one-quarter of operating income, current EPS valuation will understate the economic cost of the buildout.
-
Dilution and capital allocation. Oracle completed a USD 20 billion ATM and already has mandatory convertible preferred securities. A diluted share count above 3.1 billion or another major equity raise without improved cash conversion would reduce per-share participation in growth.
-
Legacy migration and application competition. Software revenue fell 3% while cloud applications grew 10%. If application growth drops below high single digits and software declines accelerate, the legacy base would stop cushioning OCI investment and group margins would become more volatile.
6. Monitoring Checklist
-
Q2 total revenue growth: 32% or better strengthens the view; below 30% would miss the company range and weaken confidence in capacity conversion.
-
Q2 cloud and OCI growth: cloud growth at or above 68% and OCI above 100% would confirm continued share gain. OCI below 100% before supply constraints ease is a warning.
-
RPO conversion: RPO can grow more slowly if revenue accelerates, but sequential RPO decline combined with revenue below guidance would indicate contract slippage or weaker demand.
-
Capacity and utilization: another substantial capacity addition, paired with revenue growth and stable margins, supports the thesis. Capacity additions without OCI revenue conversion would indicate underutilization.
-
GAAP operating margin and depreciation: margin above 33% despite rising depreciation strengthens the economic case; below 33% suggests the capital program is reaching the income statement faster than revenue matures.
-
Net cash outlay for capex: below USD 18 billion per quarter or a falling ratio to OCI revenue would improve funding quality. Above USD 20 billion for multiple quarters would increase financing risk.
-
Customer prepayments and FCF: prepayments should support, not fully explain, OCF. Underlying OCF excluding financing-like prepayments should rise toward capex as OCI scales.
-
Debt, interest, and share count: net debt below USD 90 billion, interest below 25% of operating income, and diluted shares below 3.1 billion support the positive view. Breaching two of these thresholds would weaken per-share economics.
-
Peer momentum: compare Oracle’s OCI growth and margin trend with Azure at 43%, AWS at 37% with a 39.4% margin, and Google Cloud at 82% with a 35.6% margin. Oracle needs faster growth to compensate for lower scale and greater funding dependence.
7. Sources