Author: LBank Research Analyst: Ludo
Disclaimer: This report is compiled and analyzed from publicly available information and is intended solely for information sharing and research discussion. It does not constitute investment advice, a securities recommendation, a trading instruction, or any guarantee of returns. The company operations, valuations, market prices, and consensus expectations discussed herein may change over time. Readers should independently verify the data and make their own decisions.
1. Core Conclusion
Overall judgment: Intel Corporation is making a credible operating recovery, but INTC remains expensive relative to demonstrated earnings and cash generation. Our risk-reward assessment is negative ahead of the October 29 results. The decisive variable is whether additional saleable CPU output converts into recurring cash after manufacturing investment.
-
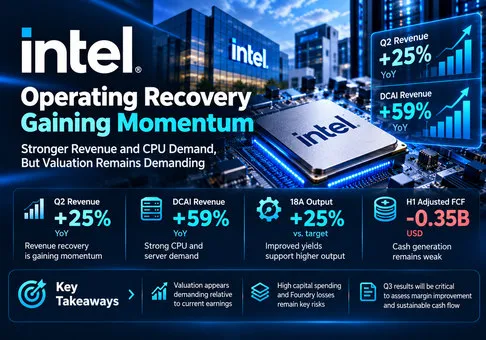
The earnings recovery is real, and the share price already requires considerably more. Q2 revenue increased 25% YoY and non-GAAP EPS reached USD 0.42. At the October 26 regular-session close of USD 90.47, the stock trades at 53.9 times four times that quarterly EPS, or 59.5 times four times the Q3 guided USD 0.38. These are annualized-quarter illustrations, not forward consensus P/E ratios. They show why a modest earnings beat alone offers insufficient valuation support.
-
CPU demand creates a credible route to growth. DCAI revenue rose 59%, while management reported 18A output approximately 25% above its internal target. Improved yields can release constrained supply, lifting shipments and reducing unit costs. This is the strongest reason to take the turnaround seriously; the investment case depends on sustained execution across subsequent quarters.
-
Cash conversion is weaker than the operating cash-flow headline suggests. H1 operating cash flow was USD 8.102 billion. Subtracting investing-classified PP&E payments gives USD 1.910 billion, but also deducting financing-classified PP&E and finance-lease payments leaves a negative USD 0.345 billion. Customer deposits received during Q2 further improve near-term liquidity ahead of product delivery. The stock needs evidence of recurring cash generation beyond these timing effects.
-
Funding capacity has improved at a cost to per-share economics. The August offering and fully exercised option cover approximately 242.1 million shares at USD 95, equivalent to USD 23.0 billion gross. The capital supports expansion, but it is financing, not operating income. At an illustrative normalized multiple of 25–30 times, USD 90.47 requires annual EPS of USD 3.02–3.62, roughly 80–115% above the Q2 annualized USD 1.68. This reverse calculation is a research sensitivity, not a price target or an asserted market multiple.
-
Classiq adds long-term optionality without resolving the near-term valuation test. The October 26 acquisition agreement targets quantum software and a broader computing platform, with closing expected in H1 2027. Financial terms and earnings contribution were not disclosed. We assign no incremental revenue or EPS to this transaction in our base case; the October 29 CPU, margin and spending disclosures remain more consequential for valuation.
Information cutoff is October 27, 2026, Asia/Shanghai. Prices refer to the latest completed U.S. regular session, October 26. Intel has not yet published Q3 results. INTCON is an Ondo tokenized equity exposure traded against USDT; its quoted token price is not used as INTC's stock price, and token ownership should not be described as direct registered ownership of Intel shares.
2. Company Overview, Business Mix, and Core Operating Metrics
Intel earns money by designing and selling processors and related silicon and by operating manufacturing facilities. Its economic model combines product franchises with a capital-intensive fabrication network. Better product demand benefits the group only to the extent that manufacturing costs, development spending and capital requirements permit an acceptable consolidated return.
CCPG serves consumer and commercial computing as well as edge and physical AI applications. OEM adoption, channel inventory, unit shipments and product mix determine revenue. A richer mix can raise revenue even when volumes fall. DCAI serves cloud operators and enterprises through server CPUs, AI-related products and purpose-built silicon. It is the main source of incremental growth and product operating profit in this recovery.
Intel Foundry supplies wafer manufacturing, packaging and related services. Most activity is for Intel's own product businesses. Internal revenue is removed upon consolidation, so adding Foundry sales to product sales substantially overstates Intel's size. External foundry customer commitments matter because they can broaden utilization and spread process-development costs across a larger revenue base. All Other includes Mobileye and IMS; the Altera deconsolidation affects year-on-year comparisons.
|
|
Products, customers and economics
|
Q2 2026 revenue, USD billion
|
Q2 operating income, USD billion
|
|
CCPG
|
Core PC processors, graphics and edge/physical AI; OEM and channel unit sales; premium mix supports ASP.
|
8.877
|
2.343
|
|
DCAI
|
Xeon server processors, AI and purpose-built silicon; cloud and enterprise customers; volume and product mix drive economics.
|
6.262
|
2.474
|
|
Intel Foundry
|
Wafer fabrication, packaging and related services; predominantly internal customers; utilization, yields and depreciation determine returns.
|
5.765
|
-2.089
|
|
All Other
|
Mobileye, IMS and other activities; automotive technology and mask-writing exposure. Altera is no longer consolidated.
|
0.701
|
0.230
|
|
Consolidation bridge
|
Subtract 5.477 of intersegment revenue. Corporate unallocated operating loss of 1.416 and elimination profit of 0.254 reconcile segment profits.
|
16.128
|
1.796
|
Amounts are segment disclosures, before consolidation where applicable. Segment margins use internal transfer pricing and allocated expenses; they are not standalone cash returns or directly comparable with consolidated peer margins.
Core operating metrics and changes
|
Metric or event
|
Latest verified observation
|
Reference or implication
|
|
Q2 revenue and margins
|
Revenue USD 16.128 billion; +25% YoY; GAAP gross margin 40.4%; non-GAAP 41.8%.
|
The recovery is material; profitability still trails leading peers.
|
|
Q2 earnings
|
GAAP EPS -USD 2.16; non-GAAP EPS USD 0.42.
|
Non-operating accounting movements make headline GAAP EPS a poor measure of product demand.
|
|
Q3 management outlook
|
Revenue USD 15.8–16.8 billion; midpoint USD 16.3 billion; non-GAAP gross margin 42.0% and EPS USD 0.38.
|
July 23 outlook; Q3 results are scheduled for October 29, after the U.S. close.
|
|
Secondary consensus
|
Earnings Whispers: revenue USD 16.44 billion; non-GAAP EPS USD 0.39, accessed October 27.
|
Secondary, non-primary consensus source; update methodology and constituent estimates were not independently audited.
|
|
Manufacturing and spending
|
Q2 prepared remarks: 18A output about 25% above target; 2026 capex above USD 20 billion; 2027 significantly higher.
|
Better supply can lift sales before the resulting investment earns an adequate return.
|
|
Classiq agreement
|
Announced October 26; proposed acquisition; expected closing in H1 2027, subject to approvals and customary conditions.
|
No disclosed purchase price or quantified earnings contribution in the announcement.
|
The Q2 recovery combines stronger product demand with factory execution. It should be assessed through deliverable product supply, unit cost and gross profit, rather than technical milestones in isolation. More wafers have little economic value if yields disappoint, inventory does not match customer requirements or the new capacity earns inadequate margins.
The October 12 OCP announcement broadens the inference proposition through Xeon-based systems and the GPU D-series. Customer sampling is evidence of product progress, while deployment volumes and customer economics remain the relevant commercial tests. We do not extrapolate announced specifications into market share or group earnings. Similarly, Classiq's software capabilities may improve Intel's quantum positioning, but the pending transaction cannot explain current-quarter operating results.
October 29 preview and research scenarios
The official revenue range is the principal reference point. The Earnings Whispers snapshot places secondary consensus at USD 16.44 billion and non-GAAP EPS at USD 0.39, slightly above management's midpoint and EPS outlook. We use that source as an expectations indicator; it does not establish a complete, independently reconciled analyst consensus. No options-implied move or proprietary whisper number is required for our fundamental conclusion.
Our base case is revenue near USD 16.5 billion and non-GAAP gross margin around 42%. That would sustain the operating recovery while leaving the valuation debate largely intact. The main question would move to the next-quarter guide and the cost of supplying additional demand.
A positive case requires revenue above USD 16.8 billion, non-GAAP gross margin at least 43%, and evidence that more output is translating into cash without another disproportionate increase in spending. That combination would weaken our negative risk-reward assessment because it would improve both earnings scale and earnings quality.
A negative case is revenue below USD 15.8 billion or non-GAAP gross margin below 41%, particularly if equipment commitments and capital spending remain elevated. Revenue disappointment accompanied by fixed factory costs would compress profits and cash simultaneously. These are research scenarios and decision thresholds, not reported outcomes, company guidance or probabilistic forecasts. We do not forecast a percentage share-price reaction from an earnings print.
3. Fundamental Quality
Growth quality is improving, consolidated profitability is recovering, and recurring cash returns remain the weakest part of the case. The proper distinction is between operating progress, accounting volatility and financing. Treating any one of these as a substitute for the others produces an unreliable valuation.
|
Metric
|
Earlier observation
|
Latest observation
|
Assessment
|
|
Revenue
|
H1 2025: USD 25.526 billion
|
H1 2026: USD 29.705 billion
|
16.4% growth, calculated; portfolio changes affect comparability.
|
|
GAAP gross margin
|
H1 2025: 32.2%
|
H1 2026: 39.9%
|
Calculated from gross profit and revenue; clear recovery.
|
|
GAAP operating income
|
H1 2025: -USD 3.477 billion
|
H1 2026: -USD 1.340 billion
|
Improved, but first-half consolidated operations remained loss-making.
|
|
GAAP EPS
|
H1 2025: -USD 0.86
|
H1 2026: -USD 2.89
|
Distorted by non-cash and non-operating charges.
|
|
Operating cash flow
|
H1 2025: USD 2.863 billion
|
H1 2026: USD 8.102 billion
|
Strong improvement; H1 2026 includes customer deposit receipts.
|
|
Cash PP&E payments in investing activities
|
H1 2025: USD 8.733 billion
|
H1 2026: USD 6.192 billion
|
This cash-flow line alone understates total cash payments for factory assets.
|
|
CFO less investing PP&E payments
|
H1 2025: -USD 5.870 billion
|
H1 2026: USD 1.910 billion
|
A simple FCF proxy, before other factory-related financing payments.
|
|
Broader cash residual
|
H1 2025: -USD 7.841 billion
|
H1 2026: -USD 0.345 billion
|
Research calculation after financing-classified PP&E payments and finance-lease payments; before partner funding.
|
|
Cash and short-term investments
|
December 27, 2025: USD 37.416 billion
|
June 27, 2026: USD 29.727 billion
|
Historical balance; precedes the August equity offering.
|
|
Total debt
|
December 27, 2025: USD 46.585 billion
|
June 27, 2026: USD 50.537 billion
|
Borrowings rose despite the operating cash-flow recovery.
|
Gross margins are calculated from disclosed gross profit divided by revenue. The broader cash residual is a research measure: CFO minus investing PP&E payments, financing PP&E payments and finance-lease payments. H1 2026: 8.102 - 6.192 - 1.423 - 0.832 = -0.345, in USD billion. H1 2025: 2.863 - 8.733 - 1.962 - 0.009 = -7.841. This is not Intel's reported adjusted FCF and does not deduct acquisitions or partner distributions; partner contributions and government incentive receipts are not added. It combines payments for current and earlier asset commitments to assess cash financing needs, rather than current-period accrual capex.
The change from deeply negative cash generation is substantial. Nevertheless, H1 customer deposits of USD 1.7 billion, received in Q2, bring cash forward from future delivery obligations. A simple sensitivity subtracting those receipts from the broader residual produces negative USD 2.045 billion. This is not a restatement of GAAP cash flow: customer deposits are legitimate operating cash, and supplier prepayments also depress the period's cash generation. It illustrates why one strong quarter does not establish a repeatable distributable cash run rate.
The GAAP net loss needs equally careful interpretation. Q2 included a USD 12.529 billion mark-to-market loss on Escrowed Shares. That is separate from operating income and is not a cash operating cost of manufacturing CPUs. Removing its narrative distortion helps identify the product recovery. It does not justify ignoring stock compensation, process investment or the capital needed to sustain competitiveness.
Capital allocation remains demanding. Management's Q2 prepared remarks placed 2026 capex above USD 20 billion and 2027 significantly higher. The June balance sheet precedes the August offering, so June net debt should not be represented as today's enterprise-value bridge. The offering improves financing capacity, while future cash requirements determine how much of that improvement survives. The Classiq agreement adds another allocation decision whose return cannot yet be quantified.
A reproducible business-to-valuation chain
Consider a research sensitivity in which incremental saleable server output raises annual server unit shipments by 12%, while ASP declines 5% as mix normalizes. Starting with Q2 DCAI revenue of USD 6.262 billion less USD 0.951 billion of other DCAI revenue gives a USD 5.311 billion quarterly server base. Annualizing this base gives USD 21.244 billion. The assumed revenue change is 1.12 × 0.95 - 1 = 6.4%, producing USD 1.360 billion of incremental annual server sales.
At an assumed 40% incremental operating contribution and 11% tax rate, incremental earnings are about USD 0.484 billion. With an illustrative 5.35 billion share denominator, this adds approximately USD 0.090 annual EPS. Assuming incremental cash investment of USD 0.300 billion and working capital of USD 0.100 billion leaves roughly USD 0.084 billion of incremental FCF, before other changes. We assume no incremental depreciation adjustment, financing cost or minority-interest leakage in this simplified bridge. The share denominator approximates Q2 weighted shares plus the August issuance and is not an audited post-offering diluted share count.
At an illustrative 25 times earnings, the EPS increment contributes about USD 2.26 per share to value. Each input is explicit and replaceable. The conclusion is that a commercially useful supply improvement can still have a modest per-share valuation effect after capital requirements. A much larger improvement requires sustained volume, favorable mix, lower manufacturing cost or materially narrower Foundry losses. The most important variable is the recurring cash generated per additional unit of saleable CPU output after the associated investment.
4. Industry and Competitive Landscape
The relevant industry has three overlapping profit pools: general-purpose processors, accelerated AI computing and outsourced advanced manufacturing. They should not be merged into a single AI market-share estimate. CPU demand can grow alongside GPU adoption, while the greatest share of incremental infrastructure profit accrues to a different supplier.
|
Competitive arena
|
Observable scale or position
|
Who is gaining and why
|
Implication for Intel
|
|
Server and PC CPUs
|
Intel DCAI revenue USD 6.262 billion; AMD Data Center about USD 6.7 billion in Q2 2026.
|
Both grew; AMD combines CPU and GPU revenue, preventing a CPU-share inference.
|
Intel is benefiting from expanding compute demand; relative revenue alone does not prove share recovery.
|
|
AI accelerators and systems
|
NVIDIA Data Center revenue USD 89.0 billion in fiscal Q2 2027.
|
NVIDIA captures much greater disclosed AI infrastructure revenue.
|
Xeon adjacency supports Intel growth, while accelerator platform economics remain elsewhere.
|
|
Leading-edge manufacturing
|
TSMC Q3 2026 revenue USD 46.72 billion; Intel Foundry external Q2 revenue USD 0.293 billion.
|
TSMC demonstrates substantial external customer demand and profitable scale.
|
Intel has an internal production recovery; external foundry commercial validation is still limited.
|
|
Enterprise inference and quantum
|
Intel GPU D-series customer sampling; Classiq transaction pending.
|
Intel is broadening its product and software options; adoption economics are not yet quantified.
|
Assign no incremental near-term earnings to either announcement in the base case.
|
These are scale indicators, not market-share denominators. Intel Foundry's external sales include business that became external following Altera's deconsolidation. Semiconductor node names and product benchmark specifications are not uniform measures of commercial manufacturing leadership.
|
Company and period
|
Revenue, USD billion
|
YoY revenue growth
|
Reported gross margin
|
Relevant operating evidence
|
|
Intel Corporation; Q2 2026
|
16.128
|
25%
|
40.4% GAAP
|
DCAI +59%; Foundry operating loss USD 2.089 billion.
|
|
Advanced Micro Devices, Inc.; Q2 2026
|
11.536
|
50%
|
54% GAAP
|
Data Center +107%; group GAAP operating margin 17%.
|
|
NVIDIA Corporation; fiscal Q2 2027, ended July 26, 2026
|
96.221
|
106%
|
75.0% GAAP
|
Data Center USD 89.0 billion; Q3 revenue guide USD 108.0 billion, plus or minus 2%.
|
|
Taiwan Semiconductor Manufacturing Company Limited; Q3 2026
|
46.72
|
41.2% in USD
|
66.4% TIFRS
|
Operating margin 58.7%; advanced nodes of 7nm and below were 79% of wafer revenue.
|
Comparability is approximate: fiscal periods differ; Intel and AMD mix several product categories; NVIDIA includes systems and networking; TSMC is a foundry and reports under TIFRS. USD growth for TSMC is used consistently with its USD revenue column. Gross margins are reported group measures, not standardized economic returns; no peer valuation multiple is inferred from this table.
NVIDIA and TSMC are the clearest current winners in disclosed scale and profitability. AMD is also winning incremental compute demand, with faster disclosed Data Center growth than Intel. Intel is a net beneficiary of the compute expansion, but remains the weaker converter of that demand into consolidated cash returns. Within Intel, the losing economic position remains Foundry's operating deficit. This is a judgment about current economics, not a prediction that its technology roadmap will fail.
Intel can improve that position through better internal utilization and lower process costs before a large external foundry business emerges. The two routes should be monitored separately. Internal manufacturing success validates production capability; third-party wins validate service quality, customer trust and commercial competitiveness. Reclassifying an existing relationship as external revenue is not equivalent to winning an independent leading-edge design.
For CPUs, share claims require matched product categories, shipment or revenue denominators and comparable periods. The disclosed AMD Data Center total includes accelerators, so its comparison with DCAI cannot identify server CPU share. Our negative valuation assessment does not require an assumed share loss: it follows from Intel's own earnings, cash requirements and price. Conversely, evidence of durable CPU gains and profitable external commitments would strengthen the case for a higher normalized earnings base.
5. Key Risks
-
Supply and yield execution: If saleable output misses customer needs, revenue can fall below the guided range while factory depreciation and development costs persist. Lower utilization would reduce margins and delay cash recovery.
-
Mix and pricing normalization: If premium product mix or scarcity pricing fades before volumes accelerate, revenue per unit declines. The resulting gross-profit shortfall would limit operating leverage and make the current earnings multiple harder to support.
-
Investment outruns monetization: If capex rises beyond the already elevated spending outlook without proportionate committed demand, current cash is consumed before new facilities generate returns. Financing requirements and valuation discount rates would rise.
-
Cash timing reverses: If customer deposits normalize or working capital absorbs more cash, reported CFO could weaken despite higher revenue. A positive headline FCF measure could then obscure broader factory-related payment needs.
-
External Foundry adoption disappoints: If technical milestones do not produce binding customer commitments and profitable volume, internal demand must bear more process-development cost. Persistent losses would reduce the group's normalized earnings power.
-
Competition and architecture substitution: If AMD gains CPU demand or NVIDIA and other architectures capture more of the system budget, Intel's pricing and mix could deteriorate even in a growing overall compute market.
-
Capital allocation and dilution: If the Classiq transaction or further investments require substantial resources without measurable returns, available financing would not translate into equivalent per-share value. Additional issuance would increase the earnings required to support the share price.
-
Our cautious assessment could be wrong: If yields, shipment growth and cash conversion improve together and Foundry losses narrow rapidly, the current quarterly earnings base would understate normalized profits. A sustained upward revision could support a premium despite our valuation concerns.
6. Monitoring Checklist
-
October 29 revenue and next-quarter outlook: Above USD 16.8 billion strengthens the operating case; below USD 15.8 billion weakens it. Guidance should demonstrate further deliverable supply growth, rather than demand commentary alone.
-
Non-GAAP gross margin: At least 43% would improve the earnings trajectory; below 41% would weaken it. Check whether the change reflects yields, mix, inventory charges or pricing.
-
DCAI momentum: Growth above Q2's 59% YoY rate would support the demand thesis. Read unit volume and ASP alongside revenue, separating server CPUs from other DCAI products.
-
Foundry economics: Quarterly operating losses below USD 2.0 billion, accompanied by better utilization and cost, would strengthen the recovery. Check external sales against the USD 0.293 billion Q2 base and distinguish new wins from portfolio reclassification.
-
Cash conversion: Require a positive broader cash residual over two consecutive quarters, calculated consistently, and inspect deposit movements. A result dependent on additional deposits would not establish recurring cash quality.
-
Spending commitments: Compare updated 2026 capex with the above-USD 20 billion outlook and obtain a clearer 2027 plan. Faster investment without customer-backed volume and returns would reinforce the cautious valuation view.
-
Per-share earnings and funding: Reconcile the August issuance with updated diluted shares and minority interests. Progress toward annual earnings power of USD 3.02–3.62 would address the reverse-valuation hurdle; those figures are research requirements, not company targets.
-
Classiq economics and close: Track the expected H1 2027 closing, consideration, funding and operating contribution. Assign financial value only when disclosures allow a defensible estimate.
7. Sources
Primary financial statements, company announcements and peer releases were checked for this report. Management outlooks retain their original publication dates. Secondary consensus is explicitly identified; scenario assumptions and valuation sensitivities are our calculations. LBank pages establish tokenized-stock market eligibility only. Direct HTTP captures of the three candidate trading pages contained populated quotes, daily ranges, quote volume and trading controls; these snapshots do not establish executable depth or synchronized stock prices. The selected issuer was last covered on July 24, 95 days before this report; AMD was excluded from selection because its August 5 coverage was within 90 days.
-
-
-
Q2 2026 Prepared Remarks (https://d1io3yog0oux5.cloudfront.net/_0b73b58ec4299bfad2a70bdb80903760/intel/db/887/9266/prepared_remarks/Q2+2026+Prepared+Remarks.pdf) — July 23, 2026; downloaded from the IR financial-results page; manufacturing, capex and outlook.
-
-
-
-
-
-
Intel Stock Price History (https://stockanalysis.com/stocks/intc/history/) — Secondary market-data source; October 26 regular-session close USD 90.47; accessed October 27.
-
-
-
-
TSMC Reports Third Quarter EPS of NT29.43 (https://pr.tsmc.com/schinese/news/3346?trk=article-ssr-frontend-pulse_little-text-block) — October 15, 2026; title currency notation normalized for Feishu compatibility; original title contains the local-currency symbol.
-
-
INTCON/USDT Spot Trading | LBank (https://www.lbank.com/trade/intcon_usdt) — Direct HTTP trading-interface capture verified October 27, 2026; no token quote used in stock valuation.
-
-
-
AMDON/USDT Spot Trading | LBank (https://www.lbank.com/uk/trade/amdon_usdt) — Candidate interface verified October 27, 2026; quote and trading controls populated.
-



 Transfer