Author: LBank Research Analyst: Ludo
Disclaimer: This report is compiled and analyzed from publicly available information and is intended solely for information sharing and research discussion. It does not constitute investment advice, a securities recommendation, a trading instruction, or any guarantee of returns. The company operations, valuations, market prices, and consensus expectations discussed herein may change over time. Readers should independently verify the data and make their own decisions.
1. Core Conclusion
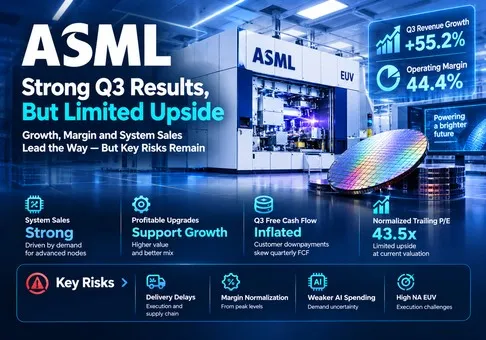
Overall judgment: ASML Holding N.V. is an exceptional semiconductor equipment franchise, but the equity already discounts substantial execution. At approximately 43.5x trailing earnings after an illustrative adjustment for the Mistral AI revaluation gain, valuation is stretched and the near-term risk/reward is cautious. The decisive variable is how quickly committed customer demand becomes accepted, profitable production capacity.
-
The growth acceleration is economically meaningful. Q3 revenue rose 55.2% year over year and operating margin reached 44.4%. That combination supports a stronger earnings base; it also means investors should test whether incremental upgrades and tool deliveries can sustain the improvement rather than extrapolate one quarter.
-
Reported EPS overstates the improvement in recurring earnings. A EUR 509.7 million equity-investment gain contributed to diluted EPS of EUR 12.93. Using the quarter’s 16.1% effective tax rate as an illustrative allocation gives a EUR 1.12 per-share adjustment. This is our analytical normalization, not company-reported adjusted EPS or a precisely disclosed investment-specific tax result.
-
The cash inflow improves financial resilience but has a delivery obligation attached. Q3 FCF was EUR 11.3504 billion. Customer downpayments were an important driver, and non-current contract liabilities increased sharply. Future tool delivery consumes the cash-funded obligation; annualizing quarterly FCF would materially overstate sustainable distributable cash.
-
Guidance improves, although less dramatically than the quarterly earnings headline. Full-year sales guidance moves from EUR 43–45 billion to EUR 44–45 billion, a 1.1% midpoint increase. The higher floor reduces downside uncertainty. It does not independently establish a new multi-year valuation regime.
-
A premium is justified; easy upside is not. The October 14 Nasdaq close of USD 1,650.00 and the same-day ECB translation of EUR 1 = USD 1.1195 imply 42.1x reported trailing diluted EPS of EUR 35.00 and 43.5x our normalized EUR 33.88. The stock requires continued earnings growth even after the earnings-day decline.
Our illustrative FY2026 recurring diluted EPS is EUR 41.20. It combines nine-month diluted EPS with a Q4 operating bridge using revenue of EUR 14.7 billion, 57% gross margin, EUR 1.6 billion operating expenses, 17% tax and 383.5 million diluted shares, while removing the estimated Q3 revaluation contribution. We assume zero incremental interest and equity-method income in Q4. At the stated exchange rate, the price is about 35.8x that modeled earnings figure. This is an internally constructed scenario, not management EPS guidance or consensus.
For 2027, an illustrative EPS/multiple sensitivity makes the dependency concrete: EUR 45 at 30x translates to USD 1,511, roughly 8.4% below the reference close; EUR 50 at 35x gives USD 1,959, about 18.7% above; EUR 60 at 40x gives USD 2,687, about 62.8% above. These are conditional arithmetic cases, exclude dividends and assume unchanged FX. The upper case requires both exceptional earnings and a persistent premium. The base interpretation is a strong company whose valuation leaves limited room for production delays or weaker upgrade margins.
2. Company Overview, Business Mix, and Core Operating Metrics
ASML sells the lithography equipment that transfers circuit patterns onto wafers, alongside software, measurement equipment, maintenance and upgrades. Its customers are semiconductor manufacturers rather than cloud customers buying computing services. Spending by AI developers reaches ASML through chip demand, manufacturing economics, customer capital budgets, fab readiness and eventual equipment acceptance. Each intermediate step can change the timing of revenue recognition.
System revenue depends on tool volumes, configuration, technology mix and recognition conditions. Installed Base Management monetizes the equipment already in factories through service and field options. The business therefore earns from both new manufacturing capacity and greater output from existing capacity. The latter can be particularly attractive when customers need wafer throughput before a new fab is ready. Separate operating profit for EUV, DUV and services is not disclosed in the materials used here, so their profit contribution cannot be assigned with precision.
|
Business / exposure
|
Q3 2026 revenue
|
Role and economics
|
|
EUV systems
|
Around EUR 4.1 billion
|
Advanced Logic and DRAM patterning; includes one High NA system; subcategory of system sales.
|
|
Non-EUV systems
|
Around EUR 4.3 billion
|
DUV and other non-EUV system sales; broader node and geographic exposure.
|
|
Net system sales
|
EUR 8.3732 billion; 71.8% of total
|
Capital equipment revenue; Logic 54% / Memory 46%; acceptance and mix affect timing.
|
|
Installed Base Management
|
EUR 3.2888 billion; 28.2% of total
|
Services and field options, including productivity upgrades; high-margin upgrade mix helped Q3.
|
|
Holistic lithography
|
Included above; no separate segment profit disclosed
|
Metrology, software and process optimization improve yield and customer integration.
|
EUV and non-EUV are components of net system sales; they must not be added again to that subtotal. Their rounded values are from the October 14 prepared remarks. Revenue shares use the financial statements. Logic and Memory percentages refer to system sales, not consolidated revenue. “Installed Base Management” includes upgrades whose timing and margins can differ substantially from recurring maintenance fees.
Core operating metrics and changes
The cleanest earnings comparison is against ASML’s own prior guidance. Q3 revenue exceeded the EUR 11.5 billion midpoint by EUR 162 million, or 1.4%, while gross margin exceeded the 56% midpoint by 1.5 percentage points. That establishes a genuine execution improvement without relying on conflicting secondary consensus figures that mix euros, dollars and basic versus diluted EPS. We do not publish an unverified consensus beat/miss estimate.
|
Metric / event
|
Previous reference
|
Current observation
|
Investment interpretation
|
|
Q3 net sales, EUR billion
|
Q2 2026: 9.3265
|
11.6620
|
25.0% sequential growth; 55.2% above Q3 2025.
|
|
Q3 sales versus prior guide
|
EUR 11.0–12.0 billion
|
EUR 11.6620 billion
|
1.4% above midpoint, below the upper end; compare with company guidance.
|
|
Q3 gross margin
|
Prior guide: 55–57%
|
57.5%
|
1.5 percentage points above midpoint; upgrade mix is important.
|
|
Q4 sales / gross-margin guide
|
New October outlook
|
EUR 14.2–15.2 billion / around 57%
|
Midpoint requires about 26.1% sequential revenue growth.
|
|
FY2026 revenue guide
|
EUR 43–45 billion
|
EUR 44–45 billion
|
Floor raised; midpoint rises 1.1%; ceiling unchanged.
|
|
FY2026 gross-margin guide
|
54–56%
|
Around 56%
|
Higher expected annual profitability.
|
|
Capital return
|
Q3 2026
|
Around EUR 4.1 billion buybacks
|
Interim dividend EUR 1.88 payable November 4.
|
|
Supply roadmap
|
2027 capacity expansion intent
|
30% for Low NA EUV and DUV immersion
|
Capacity, output and recognized sales remain different measures.
|
The new Q4 midpoint implies approximately EUR 11.0 billion of system revenue if Installed Base Management reaches management’s roughly EUR 3.7 billion expectation. That would require a large system-sales step-up. The annual range is consistent with a strong fourth quarter, but the relative importance of acceptance timing rises as the year-end delivery target grows.
For research selection, ASMLUSDT Futures, AMDON/USDT Spot and COSTON/USDT Spot were opened before the company was selected. Each displayed a trading interface; entity mapping was checked against LBank stock information or official listing notices. ASML was last covered on July 2, outside the 90-day exclusion window, whereas Costco was covered on October 9. The October 14 ASML release provides the strongest immediate company-specific research trigger in this verified pool. No desktop browser or LBank API was used.
The linked instrument is a USDT-settled perpetual contract. It does not convey ASML shareholder ownership or cash-dividend rights. Its funding, leverage, liquidation mechanics and basis can produce a return different from the underlying equity. We use the Nasdaq equity close exclusively for valuation; the LBank interface’s unavailable live mark price is omitted.
3. Fundamental Quality
Growth quality is strong, operating leverage is substantial, and liquidity is comfortable. Reported net earnings and quarterly cash conversion both need normalization. System sales and Installed Base Management grew together, which is a healthier pattern than growth dependent on a single new product. However, unusually profitable upgrades and an investment revaluation make the net margin a poor standalone measure of through-cycle economics.
|
US GAAP unless stated; EUR million
|
Q3 2025
|
Q2 2026
|
Q3 2026
|
9M 2026
|
|
Net sales
|
7,516.0
|
9,326.5
|
11,662.0
|
29,755.4
|
|
Gross margin
|
51.6%
|
54.0%
|
57.5%
|
55.0%
|
|
Operating margin
|
32.8%
|
37.1%
|
44.4%
|
39.6%
|
|
Net income
|
2,124.5
|
2,917.6
|
4,960.4
|
10,634.7
|
|
Diluted EPS, EUR
|
5.48
|
7.58
|
12.93
|
27.64
|
|
Operating cash flow
|
559.1
|
1,703.0
|
11,797.6
|
11,315.0
|
|
PP&E plus intangible purchases
|
315.4
|
386.0
|
447.2
|
1,255.5
|
|
FCF, calculated non-GAAP
|
243.7
|
1,317.0
|
11,350.4
|
10,059.5
|
|
Cash plus short-term investments, period end
|
5,128.2
|
7,581.5
|
12,735.1
|
12,735.1
|
|
Long-term debt, period end; excludes current portion
|
2,704.7
|
1,984.4
|
1,963.0
|
1,963.0
|
Source basis: ASML Financial statements US GAAP Q3 2026, pages 2–9. FCF equals operating cash flow less purchases of property, plant and equipment and intangible assets. Cash includes short-term investments. Balance-sheet amounts in the final column are September 27 balances, not nine-month averages. The debt row is long-term debt only; it is not total debt and is not used to claim a precise net-cash balance.
Profit conversion. The Q3 operating margin exceeds the prior-year level by 11.6 percentage points. The equity-investment gain sits below operating income, so it does not explain that operating improvement. Nevertheless, high-margin field options can make operating margin temporarily stronger than a normalized mix would deliver. Our base interpretation credits the business improvement but expects less extreme incremental profitability as hardware output expands.
Working capital. Q3 changes in assets and liabilities contributed EUR 7.0090 billion to operating cash flow. Non-current contract liabilities rose from EUR 3.5703 billion at June-end to EUR 9.3006 billion. These are supporting indicators of customer funding and future delivery obligations, not a complete reconciliation of all downpayments: current contract liabilities are not separately broken out in the summary balance sheet. Receivables also increased, so stronger customer financing does not eliminate collection and acceptance risk.
A useful cross-check is the nine-month view. FCF of EUR 10.0595 billion is below Q3 FCF because the first half absorbed cash. It is therefore inappropriate to multiply Q3 by four. Even a simple removal of the full Q3 working-capital contribution would be only an illustrative timing adjustment, since normal inventory, supplier and customer-payment cycles must remain in a sustainable cash model.
Capital allocation. Large repurchases reduce share count and increase per-share participation in future earnings. Their economic value depends on the repurchase valuation and future cash requirements. Downpayments can fund expansion, but distributing too much of them before delivery would reduce flexibility if customers push out schedules. Liquidity should be assessed against supplier commitments and contract obligations as well as financial debt.
Reproducible operating-to-valuation chain
Start with Q3 system sales of EUR 8.3732 billion and Installed Base Management of EUR 3.2888 billion. Assume, for a standalone next-quarter sensitivity, that systems revenue increases 20% with unchanged average mix and installed-base revenue rises 10%. Revenue becomes 8.3732 × 1.20 + 3.2888 × 1.10 = EUR 13.6655 billion. At 56% gross margin and EUR 1.6 billion operating expenses, operating profit is EUR 6.0527 billion. At 17% tax and 383.5 million diluted shares, simplified EPS is EUR 13.10, excluding interest and investment income.
If that earnings capacity persisted for four quarters, annual EPS would be EUR 52.40. At 30x and unchanged FX, the indicated equity value is approximately USD 1,760 per share. This is a sensitivity, not a forecast: the revenue assumption is below the new Q4 guide, and quarterly seasonality prevents automatic annualization. Its purpose is to show that strong volume growth can still generate modest price appreciation if the multiple compresses.
For cash flow, the same simplified quarter yields net income of EUR 5.0237 billion. Assume depreciation and amortization of EUR 0.26 billion, investment purchases of EUR 0.45 billion, no other noncash adjustments and zero net working-capital movement. Illustrative FCF is then EUR 4.8337 billion. A EUR 2.0 billion working-capital outflow would reduce it to EUR 2.8337 billion without changing EPS. This directly explains why prepayments and delivery cadence must accompany the earnings model.
The single most important variable is profitable, cash-converting capacity delivery. Tool counts alone miss product mix; bookings alone miss delivery readiness; EPS alone misses customer-funded working capital. The thesis strengthens when all three improve together over several quarters.
4. Industry and Competitive Landscape
The relevant industry is wafer-fabrication equipment and lifecycle support. Lithography establishes patterns; deposition and etch build and remove materials; inspection and metrology help manufacturers achieve yield. These steps compete for capital budgets but are often complementary. Comparing total corporate sales is useful for scale and cycle exposure, not a valid calculation of lithography market share.
|
Industry layer
|
Verified position / scale
|
Relevant competition
|
Valuation implication
|
|
EUV lithography
|
Commercial EUV leadership; around EUR 4.1 billion Q3 system sales
|
No like-for-like EUV comparator in the peer table
|
Supports a scarcity premium; demand must become accepted tools.
|
|
DUV lithography
|
Within around EUR 4.3 billion non-EUV system sales
|
Canon and Nikon are direct DUV competitors
|
Mature-node spending and pricing can weaken independently of AI.
|
|
Installed base and productivity
|
EUR 3.2888 billion Q3 revenue
|
Customer budget competition with new tools and other process improvements
|
Strong monetization; upgrades have a different cadence from service contracts.
|
|
Materials engineering and etch
|
Applied Materials and Lam Research are adjacent equipment leaders
|
Different process steps; not EUV substitutes
|
AI spending can support several vendors simultaneously.
|
|
Process control
|
KLA quarterly revenue USD 3.658 billion
|
Inspection, metrology and overlapping optimization budgets
|
Complexity creates complementary demand; no blanket equipment-market share claim.
|
The most attractive industry position belongs to a vendor whose technology becomes more necessary as customer manufacturing complexity rises. ASML benefits when advanced Logic and DRAM require greater lithography intensity. Memory exposure also creates cyclicality: stronger semiconductor pricing can accelerate capacity plans, while an inventory correction can postpone them. Longer planning horizons improve production visibility but do not remove this cycle.
|
Company / period
|
Revenue / growth
|
Profitability, GAAP
|
Cash flow or operating indicator
|
|
ASML Holding N.V.; Q3 ended September 27, 2026
|
EUR 11.662 billion; +55.2% YoY
|
Gross margin 57.5%; operating margin 44.4%
|
FCF EUR 11.3504 billion; heavily influenced by downpayments.
|
|
Applied Materials, Inc.; Q3 FY2026 ended July 26
|
USD 9.115 billion; +24.8% YoY
|
Gross margin 50.3%; operating margin 33.7%
|
OCF USD 3.04 billion; FCF USD 2.330 billion.
|
|
Lam Research Corporation; quarter ended June 28, 2026
|
USD 6.722238 billion; +30.0% YoY
|
Gross margin 51.7%; operating margin 37.4%
|
Customer support and other revenue USD 2.472390 billion.
|
|
KLA Corporation; Q4 FY2026 ended June 30
|
USD 3.658 billion; +15.2% YoY
|
Net income USD 1.363 billion; net margin 37.3%
|
OCF USD 906.4 million; FCF USD 817.1 million.
|
Peer figures are from the companies’ latest identified reported quarters as of October 15. Periods differ by up to three months and currencies differ. Growth is calculated from each company’s own prior-year quarter; margins use GAAP. KLA’s net margin is not comparable to peers’ operating margins. FCF definitions and customer prepayment patterns differ; no currency conversion or cross-company revenue-share calculation is imposed.
Who is winning? ASML is a net beneficiary of advanced-node complexity and installed-base monetization. Lam Research is also a beneficiary through etch, deposition and lifecycle spending; its systems and support revenue both increased in the June quarter. Applied Materials benefits from materials engineering and advanced packaging, with record revenue and stronger margins. KLA monetizes the rising cost of yield errors as processes become more complex. Their results support a broad equipment investment cycle rather than a thesis that all incremental spending accrues to ASML.
Who is losing? Our structural judgment is that suppliers concentrated in older, commoditized tools face the greatest risk of losing relative budget share when customers prioritize advanced-node productivity. Canon and Nikon compete directly in DUV, but the cited evidence does not establish that either lost measured market share in Q3 2026. We therefore identify the challenged category and direct competitors without inventing a current share-loss statistic. ASML’s own mature-node exposure can participate in that weaker segment.
The moat also contains a dependency. A highly specialized supplier network is difficult to replicate, but hard to expand quickly. Critical optics availability can constrain an otherwise dominant toolmaker. A capacity plan can therefore support pricing power while simultaneously limiting near-term sales. The correct valuation premium rewards durable economics and disciplined execution; it should not treat unmet demand as already recognized profit.
High NA EUV adds long-term product opportunity and execution complexity. Qualification, customer economics, throughput and production adoption matter more than demonstration milestones. Customers can improve existing Low NA productivity while evaluating High NA, changing the mix and timing of ASML’s revenue. This can be attractive economically even when a headline new-tool shipment schedule changes.
5. Key Risks
-
Supply expansion falls behind commitments. If critical optics, components or trained labor prevent the planned capacity increase, shipments and acceptances lag. Revenue shifts out while R&D and infrastructure spending continue, lowering operating leverage and the multiple investors will pay for distant earnings.
-
Customer prepayments stop expanding or reverse. A pause in new deposits combined with fulfillment of existing commitments can reduce OCF sharply even during revenue growth. That weakens buyback capacity and exposes valuations based on annualized Q3 FCF.
-
Upgrade mix normalizes. If installed-base growth becomes more service-heavy or productivity upgrades become less profitable, gross margin can fall below the new run rate. At high valuation, a modest margin change can produce a larger equity repricing than the revenue change suggests.
-
AI spending slows or memory capacity overshoots. If customer returns on new infrastructure disappoint or memory inventories rebuild, equipment commitments can be deferred. The path runs from fab budgets to order timing, acceptance schedules and recurring earnings expectations.
-
Export restrictions broaden. Reduced ability to deliver or service restricted tools would shrink accessible revenue and installed-base monetization. The impact depends on actual licensing and product scope; this report does not assume an unverified new restriction.
-
High NA commercialization takes longer. Delayed qualification or weaker customer economics would defer premium product revenue while development spending remains. Existing products can cushion the impact but may not support the same long-term growth multiple.
-
Financial optics obscure operating performance. Further investment revaluations, changing tax mix, euro-dollar moves or aggressive repurchases can move EPS independently of tool economics. Investors who capitalize those effects as permanent operating growth risk overestimating intrinsic earnings power.
6. Monitoring Checklist
-
Q4 recognized revenue: EUR 14.2–15.2 billion is the company range. Delivery below the lower bound without an offsetting structural explanation weakens execution confidence.
-
Gross margin and upgrade mix: Around 57% is Q4 guidance. A sustained fall below 55%, our analytical warning threshold, would challenge the high-margin growth thesis.
-
Installed Base Management: Compare Q4 with management’s approximately EUR 3.7 billion expectation and distinguish upgrades from maintenance. Growth with stable profitability strengthens earnings durability.
-
Cash conversion over a rolling year: Track OCF, investment purchases, receivables and both current and non-current contract liabilities together. Our warning trigger is two consecutive quarters of revenue growth accompanied by negative FCF, unless disclosed expansion spending explains the divergence.
-
Capacity delivery: Assess progress against the 30% 2027 capacity expansion intent for Low NA EUV and DUV immersion. Downgrades or repeated acceptance delays weaken the premium; capacity should not be confused with booked sales.
-
Recurring EPS versus price: Recalculate the normalized trailing multiple and the Q4 bridge after each release. Sustained earnings growth can make today’s valuation more reasonable; a multiple above 40x with slowing recurring growth would reinforce caution.
-
Dated events: November 4, 2026 interim dividend payment and June 10, 2027 Capital Markets Day. The dividend is an equity event and does not imply payment to perpetual-contract holders. At Capital Markets Day, focus on capacity economics and capital requirements as well as the addressable opportunity.
7. Sources
All sources were checked on October 15, 2026. Financial data are in EUR unless USD is explicitly stated. Financial periods follow ASML’s fiscal quarter ending September 27. Calculations use unrounded inputs where available. The Nasdaq close uses StockAnalysis; ChartExchange’s USD 1,649.44 observation is a last-trade cross-check, a 0.034% difference that does not affect the thesis. ECB FX is a reference translation of earnings, not the historical exchange rate used to generate those earnings.
No paid consensus dataset or complete Q&A transcript was available. Accordingly, the report compares results with company guidance and labels all forward EPS and valuation sensitivities as analyst assumptions. ASML is a foreign private issuer reporting under Form 20-F and furnishing interim results; a U.S. domestic-company Form 10-Q is not assumed. The live LBank funding rate and mark price were unavailable, so underlying-equity analysis cannot establish the carrying cost or executable value of ASMLUSDT.
-
-
Financial statements US GAAP Q3 2026 (https://investor.asml.com/static-files/d310262b-d037-485d-83b5-92c93cc462f0) — October 14, 2026; quarterly and nine-month statements, pages 2–9; unaudited.
-
-
Presentation Investor Relations Q3 2026 (https://investor.asml.com/static-files/44d4bee1-b2f9-41b7-b3f8-1bf28f993fe6) — October 14, 2026; business mix, technology and June 10, 2027 Capital Markets Day.
-
-
ASML 2025 Annual Report (https://www.asml.com/investors/annual-report/2025) — FY2025; US GAAP historical revenue and profitability.
-
-
ASML 2025 Form 20-F (https://www.sec.gov/Archives/edgar/data/937966/000162828026011378/asml-20251231.htm) — FY2025; SEC filing located; full HTML exceeds reader size limit. Business discussion checked against the official annual-report extract.
-
-
-
-
ASML Holding Stock Price History (https://stockanalysis.com/stocks/asml/history/) — Secondary market-data source; October 14, 2026 Nasdaq closing price USD 1,650.00.
-
ASML Historical Prices (https://chartexchange.com/symbol/nasdaq-asml/historical/) — Secondary cross-check; last displayed trade USD 1,649.44 at 15:59:58 EDT on October 14, distinct from the closing-price convention above.
-
Euro foreign exchange reference rates (https://www.ecb.europa.eu/stats/policy_and_exchange_rates/euro_reference_exchange_rates/html/index.en.html) — October 14, 2026; EUR 1 = USD 1.1195; reference translation, not a transaction rate.
-
ASMLUSDT Futures Trading | LBank Futures (https://www.lbank.com/futures/asmlusdt) — Opened October 15, 2026 by web reader and command-line HTML; ASMLUSDT Perp, margin controls and Open Long/Open Short interface visible.
-
-
-
-
-



 Transfer