Author: LBank Research Analyst: Ludo
Disclaimer: This report is compiled and analyzed from publicly available information and is intended solely for information sharing and research discussion. It does not constitute investment advice, a securities recommendation, a trading instruction, or any guarantee of returns. The company operations, valuations, market prices, and consensus expectations discussed herein may change over time. Readers should independently verify the data and make their own decisions.
1. Core Conclusion
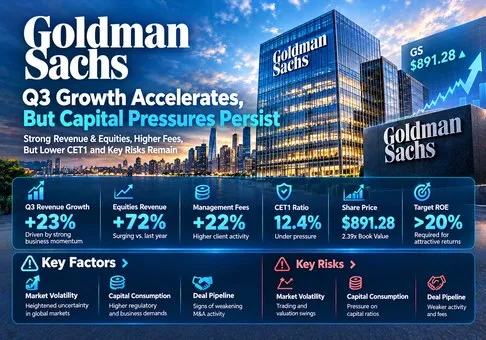
Overall judgment: Goldman Sachs is a high-quality capital-markets franchise, but the equity looks fairly valued to full at the October 15 NYSE close of USD 891.28. Our risk/reward assessment is cautiously negative because 2.39x common book value requires sustained returns close to the unusually strong year-to-date level. The decisive variable is the return earned on additional balance-sheet capacity as equity financing expands.
-
Growth is strong, with an identifiable concentration. Quarterly revenue rose 23%, while Equities generated USD 2.705 billion of the USD 3.495 billion year-over-year revenue increase, approximately 77%. That concentration makes client financing and derivatives activity the main earnings sensitivity.
-
The fee base is improving. Management and other fees grew 22% to USD 3.587 billion. The investment implication is better recurring earnings support, although incentive fees should retain a cyclical valuation treatment.
-
Capital deployment tempers the headline earnings strength. Standardized CET1 fell to 12.4% from 12.9%. Revenue growth deserves a premium only when risk-adjusted profitability compensates for the capital required to produce it.
-
A modest-looking earnings multiple can coexist with demanding economics. Four times Q3 EPS equals USD 68.04, implying 13.10x earnings. This is a run-rate calculation, not a forward forecast. The same price is 2.61x tangible book value, leaving less room for returns to normalize.
-
Our valuation framework favors patience. With an assumed 11% cost of equity and 4% perpetual book growth, sustainable ROE of 18%, 20% and 22% produces illustrative values of USD 745.28, USD 851.75 and USD 958.22. These are sensitivities, not price targets or management guidance. The base range at 18–20% ROE sits below the reference price.
The model uses P/B = (ROE − g) / (cost of equity − g), applied to common book value of USD 372.64. Conversely, 891.28 / 372.64 = 2.3918x implies sustainable ROE of 20.74% under those assumptions. This residual-income framework assumes stable returns, clean-surplus book development and a consistent payout policy. Changes in interest rates, credit risk or retained growth can materially change the result. It does not establish a precise fair price.
The reason for selecting GS is the October 13 Q3 release and October 15 GSB listing. The opened qualifying pool comprised GSB/USDT Spot, TSMON/USDT Spot and NVDAUSDT Futures. TSM and NVDA were excluded by the 90-day repeat rule; GS has no prior entry. GSB is a tokenized certificate linked to the company. Its venue price and tokenholder rights are separate from NYSE common-share valuation; this report uses the equity close exclusively.
2. Company Overview, Business Mix, and Core Operating Metrics
The Goldman Sachs Group, Inc. serves corporations, institutions, governments and wealthy clients. Its strongest economic relationship is between advice, execution and financing: an advisory mandate can create underwriting business, institutional execution can lead to prime financing, and a founder liquidity event can create wealth-management assets. This interconnected model can deepen client relationships, but several revenue streams still respond to the same capital-markets cycle.
Global Banking & Markets earns transaction fees and spreads, together with financing income. Advisory fees depend on completed transactions; underwriting depends on issuers accessing capital markets. Intermediation depends on client activity, pricing and execution, while financing adds an ongoing income relationship that consumes liquidity and regulatory capital. Asset & Wealth Management collects management fees on supervised assets and performance-related fees, while lending and investments add credit and market exposure. Platform Solutions remains relevant mainly through the economics of exiting consumer-related activities.
|
Business
|
Q3 2026 net revenue / share
|
Economic engine
|
Quality assessment
|
|
Global Banking & Markets
|
USD 13.458bn / 72.0%
|
Advisory and underwriting fees; market intermediation and financing
|
Strong franchise; sensitive to activity and balance-sheet use
|
|
Asset & Wealth Management
|
USD 5.051bn / 27.0%
|
Management fees, performance fees, lending and investments
|
More recurring fees; incentive fees remain variable
|
|
Platform Solutions
|
USD 0.170bn / 0.9%
|
Remaining consumer-related activities and exit exposures
|
Small revenue contribution; continuing execution drag
|
Business shares are calculated from reported consolidated net revenues; rounding prevents an exact 100% total. Segment profitability is not interchangeable with group profitability because capital allocation and funding differ. The larger question is whether fee growth can reduce the dependence on markets earnings without sacrificing returns through acquisition premiums or excess spending.
Core operating metrics and changes
Equities financing increased sequentially even as Equities intermediation declined. This supports a more durable revenue interpretation than one based only on a burst of trading activity. Nevertheless, financing revenues depend on client leverage, spreads, collateral quality and funding costs. The relevant question is revenue per unit of capital through stress, rather than whether financing revenue is classified as recurring.
Asset management offers a different path to growth: new mandates expand the fee base with less direct balance-sheet use. Long-term flows should be judged separately from market appreciation and liquidity-product flows. Incentive fees, investment marks and private-bank lending mean that the entire AWM segment should not be valued as a uniform management-fee annuity.
|
Operating indicator
|
Q3 2026
|
Change / interpretation
|
|
Equities revenue
|
USD 6.441bn
|
+72% YoY; -13% QoQ
|
|
Equities financing
|
USD 3.365bn
|
+96% YoY; +3% QoQ
|
|
Investment banking fees
|
USD 3.224bn
|
+21% YoY; backlog declined QoQ
|
|
Management and other fees
|
USD 3.587bn
|
+22% YoY; +7% QoQ
|
|
Assets under supervision
|
USD 4.097tn
|
USD 97bn quarterly long-term net inflows
|
|
Quarterly efficiency ratio
|
60.5%
|
Expenses / net revenues; 59.4% YTD
|
|
Capital returned to common shareholders
|
USD 4.49bn
|
USD 3.00bn repurchases plus USD 1.49bn dividends
|
Investment banking provides a useful check on extrapolation. Current completed transactions can lift revenue while the backlog contracts, so strong recognized fees do not automatically predict accelerating future fees. Similarly, an increase in supervised assets supports management fees only to the extent that assets are fee-bearing and the realized fee rate remains sound. Our base interpretation is improved franchise earnings capacity with material cyclicality still attached.
3. Fundamental Quality
Growth quality is good, with meaningful operating leverage against the prior-year quarter, but weaker sequential profitability. Pre-tax margin remains substantially above the prior-year level even after revenue-sensitive expenses increased. The cost structure contains both flexible compensation and transaction expenses and less flexible technology, occupancy and support functions. A favorable revenue mix can therefore generate large earnings changes in either direction.
|
Financial metric
|
Q3 2025
|
Q2 2026
|
Q3 2026
|
|
Net revenues, USD bn
|
15.184
|
20.338
|
18.679
|
|
Pre-tax earnings, USD bn
|
5.392
|
8.563
|
7.003
|
|
Pre-tax margin, calculated
|
35.5%
|
42.1%
|
37.5%
|
|
Net earnings, USD bn
|
4.098
|
6.628
|
5.294
|
|
Diluted EPS, USD
|
12.25
|
20.98
|
17.01
|
|
Annualized ROE
|
14.2%
|
23.5%
|
18.7%
|
|
Cash and equivalents, USD bn
|
Not used here
|
187
|
177
|
|
Unsecured borrowings, USD bn
|
Not used here
|
438
|
444
|
|
Standardized CET1
|
Not used here
|
12.9%
|
12.4%
|
|
Operating cash flow / capex
|
H1 2025: USD -31.558bn / USD 0.975bn
|
H1 2026: USD -25.763bn / USD 1.067bn
|
Q3 not in earnings materials
|
|
FCF treatment
|
Not a bank valuation anchor
|
Not a bank valuation anchor
|
Assess capital and liquidity instead
|
Quarterly P&L figures are US GAAP. Pre-tax margin is pre-tax earnings divided by net revenues. ROTE and tangible book value are company-defined non-GAAP measures. Unsecured borrowings combine short- and long-term balances. Cash-flow rows explicitly use first-half periods, unlike the quarterly P&L columns; Q3 cash flow is not inferred from changes in cash. Q3 balance-sheet and capital disclosures are preliminary estimates in the earnings materials.
The bank's cash conversion cannot be assessed with an industrial-company FCF multiple. Loans, inventory held for trading, collateralized transactions and deposits are part of producing revenue. In the first half, the mechanical subtraction of capex from operating cash flow gives USD -26.830 billion, compared with USD -32.533 billion a year earlier. That arithmetic does not measure the cash distributable to common shareholders. A negative number can reflect client business expansion, while positive operating cash flow can reflect deleveraging during deterioration. The appropriate tests are liquidity, capital generation and sustainable distributions.
Liquidity appears substantial, but the capital trend deserves close attention. Standardized RWA increased from USD 791 billion to USD 817 billion while CET1 capital edged down from USD 101.7 billion to USD 101.4 billion. That explains why strong accounting earnings did not translate into a rising capital ratio. For illustration, an additional USD 40 billion of RWA would require USD 4.96 billion of capital merely to preserve a 12.4% ratio. This is a scenario, not a forecast or a regulatory minimum. It is close to current quarterly common earnings, showing how quickly growth can absorb distribution capacity.
A reproducible earnings chain links the operating story to valuation. Assume Equities revenue falls 10% from USD 6.441 billion, a USD 644.1 million reduction. Assume 55% of lost revenue is offset by lower variable expense, leaving a 45% pre-tax contribution impact. At an assumed 24.4% tax rate and 301.1 million diluted shares, quarterly EPS declines by approximately USD 0.73: 644.1 × 45% × (1 − 24.4%) / 301.1. Four-quarter persistence would reduce annual earnings by approximately USD 2.91; a constant illustrative 13x multiple implies about USD 37.84 less equity value per share. These are analyst sensitivities, not disclosed segment margins or predictions. Capital release, changes in other businesses and a changing market multiple could offset or amplify the result.
Capital allocation is mixed. Repurchases reduce share count and can lift EPS, but purchasing above book value can dilute book value per remaining share even when earnings accretion is positive. Q3 repurchases averaged USD 1,048.73, above the reference stock close used here. That comparison describes execution timing; it does not by itself prove that the shares were misvalued when purchased. The investment test is whether the expected return exceeded alternative uses of capital.
The principal normalization issue is return sustainability. Nine-month ROE includes benefits from employee share-based award tax settlements, while Q3 includes additional charitable expense. Removing a favorable item without adjusting the unfavorable item, or vice versa, would bias the argument. Our framework therefore brackets sustainable ROE instead of presenting an adjusted quarterly EPS number as a settled forecast. The single most important variable remains incremental capital profitability in the markets franchise.
4. Industry and Competitive Landscape
The relevant competitive market includes global investment banking, institutional trading and financing, asset management and private wealth. Market volumes, issuer confidence, deal completion and client leverage drive the first two activities; fee-bearing client assets and investment performance drive the latter two. A broad bank revenue ranking is not a precise measure of share in any one of these markets.
Barriers to entry include relationships, execution technology, funding capacity, collateral management and regulatory permissions. Those barriers favor incumbents, but do not eliminate competition for compensation, balance-sheet capacity and pricing. Faster financing growth can represent better client penetration, more risk taken, or both. The report therefore compares operating growth and returns together, without assuming that revenue growth demonstrates an improvement in risk-adjusted market share.
|
Competitive arena
|
Evidence and positioning
|
Valuation implication
|
|
Advisory and underwriting
|
GS disclosed No. 1 in announced/completed M&A and equity-related offerings YTD; JPM disclosed 9.2% overall IB fee wallet share
|
Strong category positions; different ranking definitions
|
|
Equity markets
|
GS +72% YoY versus MS +41% and JPM +49%
|
GS is gaining relative momentum; growth alone is not market share
|
|
Fixed income
|
GS -1% YoY; MS -7%; JPM -4%
|
Relative resilience within a softer quarter
|
|
Recurring wealth and asset fees
|
GS AWM revenue USD 5.051bn; MS wealth revenue USD 9.065bn
|
MS has the larger wealth revenue base; GS needs a mix shift
|
The ranking claims above are company disclosures referencing Dealogic and have different product coverage. They are not contradictory and should not be combined into a single league table. Comparable disclosed equity revenues provide a more useful short-term momentum check, though differences in product mix and financing presentation remain.
|
Company / period
|
Revenue and growth
|
Return / capital
|
Competitive reading
|
|
The Goldman Sachs Group, Inc. / Q3 2026
|
USD 18.679bn; +23% YoY
|
ROTE 20.5%; CET1 12.4%
|
Equities growth winner; greater markets concentration
|
|
Morgan Stanley / Q3 2026
|
USD 20.3bn; approximately +11.5% YoY
|
ROTCE 22.6%; CET1 14.9%
|
Stronger wealth ballast; equity revenue USD 5.799bn
|
|
JPMorgan Chase & Co. / Q3 2026
|
Reported USD 50.2bn; managed USD 50.9bn
|
ROTCE 20%; CET1 13.9%
|
Diversified funding and broad IB fee leadership
|
|
Citigroup Inc. / Q3 2026
|
USD 23.845bn; +8% YoY
|
RoTCE 11.5%; CET1 12.8%
|
Lower group returns; Services is the stronger franchise
|
All peers report the September 2026 quarter. Morgan Stanley revenue growth is calculated from rounded USD 20.3 billion and USD 18.2 billion values. JPM reported and managed revenue are different accounting presentations; its ROTCE shown here is reported, rather than the 21% figure excluding its disclosed significant item. Return measures across firms are approximately comparable, not identical. GS ROTE, peer ROTCE and Citi RoTCE use different company reconciliations. No cross-company EPS ranking is used because share counts are arbitrary.
Winners and laggards: GS is the clearest relative growth winner in disclosed equity-markets revenue among GS, MS and JPM this quarter. MS has the stronger wealth revenue ballast and a higher reported group tangible return. JPM retains a diversified earnings and funding model and disclosed broad investment-banking fee leadership. Citi's group return lags, despite a strong Services franchise; it should not receive the same return-based premium merely because its total revenue is larger than GS. These are operating assessments, not peer stock recommendations.
GS is a net beneficiary of active capital markets and increased demand for financing and advice. The challenge is converting that advantage into durable shareholder returns without consuming excessive capital. In our base case, the franchise deserves a premium to lower-return banks, but the current book multiple already capitalizes substantial success. We have not assembled synchronized peer equity prices, so this conclusion is based on return economics rather than an unsupported claim that GS trades above or below a verified peer multiple median.
5. Key Risks
-
Client deleveraging: lower prime-financing balances, lower collateral values or compressed spreads would reduce financing revenue and weaken operating leverage. The earnings sensitivity in Section 3 illustrates the transmission rather than predicting a decline.
-
Capital consumption: further RWA growth without proportional CET1 generation could constrain repurchases or require lower-return asset reductions. A persistently falling standardized ratio would weaken our assessment of growth quality.
-
Deal pipeline exhaustion: continued backlog contraction, cancellations or delayed regulatory approvals could reduce future advisory and underwriting revenue after strong completed transactions have already been recognized.
-
Credit and collateral losses: impaired wholesale loans or adverse private-market marks would increase provisions, consume retained capital and challenge the premium book multiple. Secured exposure still carries collateral liquidity and wrong-way risk.
-
Fee-base reversal: sustained long-term client outflows or falling market values would reduce fee-bearing assets, while stronger competition could lower effective fees. Incentive fees can fall before the management-fee base visibly contracts.
-
Funding and discount rates: higher deposit or unsecured funding costs could compress financing spreads. A higher required equity return would independently reduce the justified book multiple, even if reported EPS held steady.
-
Exit and acquisition execution: further Apple Card markdowns or costly integration of new asset-management businesses could dilute returns. Announced acquisitions do not establish completed integration or realized synergies.
-
Upside to our cautious view: durable ROE above 22%, growing recurring fees and stable capital could justify a higher multiple. In that case our 18–20% normalization range would be too conservative; this is a specific condition that would invalidate the base judgment.
6. Monitoring Checklist
The following thresholds are research monitoring rules, not company guidance or regulatory requirements. Assess at the next quarterly release and corresponding filing; no unverified earnings date is assumed.
-
Capital: a standardized CET1 ratio stable at or above 12.4%, alongside profitable growth, supports the thesis of manageable deployment. Another decline of 50 basis points or more would materially weaken it.
-
Return sustainability: ROE of at least 20% through several quarters would support the current valuation framework. Repeated readings below 18% would increase the downside from normalization. Separate tax and unusual expense effects each time.
-
Financing franchise: Equities financing at or above USD 3.365 billion with stable capital consumption would support durability. A decline exceeding 10% accompanied by rising credit losses would challenge it.
-
Recurring fees: management and other fees at or above USD 3.587 billion, supported by positive long-term net flows, would strengthen the earnings floor. Two consecutive quarters of long-term outflows would weaken that assessment.
-
Deal replenishment: stabilization or growth in the investment-banking backlog would improve forward visibility. Further contraction alongside declining recognized fees would signal a less supportive pipeline.
-
Cost discipline: an efficiency ratio near or below 60% while recurring fees rise would support operating quality. A ratio above 63% without a clearly temporary explanation would suggest weaker earnings conversion.
-
Distribution quality: compare repurchase prices with contemporaneous expected returns and monitor book-value development. Stabilizing CET1 and rising book value alongside distributions would be more persuasive than EPS accretion alone.
-
Disclosure revision: reconcile preliminary Q3 balance-sheet, RWA and AUS data to the subsequent Form 10-Q. A material revision to capital or financing exposures would require reopening the conclusion.
7. Sources
Research cutoff: October 16, 2026, Asia/Shanghai. Equity valuation uses the October 15 regular-session close, not after-hours or LBank token prices. Sources below distinguish reported facts from our calculations and assumptions. No verified contemporaneous consensus dataset or full call transcript is incorporated; no beat/miss amount, broker target or consensus forecast is asserted. The Q3 release and filed exhibits are the latest earnings evidence used; the Q2 Form 10-Q supplies the historical cash-flow context. Preliminary Q3 data may change in the subsequent filing.
-
-
-
-
-
-
-
3Q26 Earnings Press Release (https://www.jpmorganchase.com/content/dam/jpmc/jpmorgan-chase-and-co/investor-relations/documents/quarterly-earnings/2026/3rd-quarter/6c1f8114-1be4-4174-8292-f75bbb59bc21.pdf) — 2026-10-13.
-
-
-
-
-
-
-
-



 Transfer