Author: LBank Research Analyst: Ludo
Disclaimer: This report is compiled and analyzed from publicly available information and is intended solely for information sharing and research discussion. It does not constitute investment advice, a securities recommendation, a trading instruction, or any guarantee of returns. The company operations, valuations, market prices, and consensus expectations discussed herein may change over time. Readers should independently verify the data and make their own decisions.
1. Core Conclusion
Overall judgment: Texas Instruments Incorporated is a high-quality semiconductor franchise in a powerful operating recovery, but the equity is fully valued and the risk-reward is mildly negative at the reference price. The decisive variable is sustainable free cash flow per share after CHIPS benefits and acquisition funding.
-
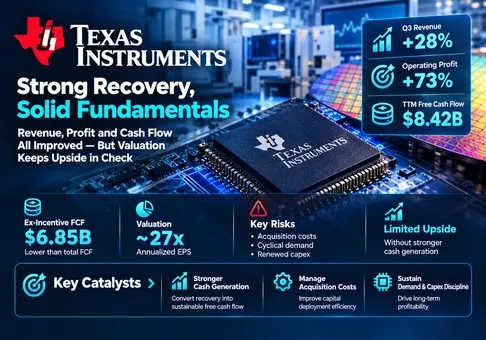
The recovery is broad and profitable. Q3 revenue of USD 6.055 billion grew 28% year over year, while GAAP operating profit rose 73% to USD 2.874 billion. Incremental operating profit divided by incremental revenue was 92.2%. That unusually high conversion argues for a substantial fixed-cost recovery, and makes extrapolation of the latest growth rate dangerous. The earnings improvement is real; its marginal profitability is unlikely to be a permanent steady state.
-
Cash generation has improved more than the headline alone explains. TTM company-defined FCF reached USD 8.422 billion. Removing USD 1.104 billion of direct CHIPS proceeds and USD 469 million of investment tax-credit cash benefits produces an analytical ex-incentive measure of USD 6.849 billion. This is still a large recovery, but gives a materially smaller cash base for valuation and distributions. The adjustment is our analytical measure, not a management forecast.
-
The share price already requires sustained strong earnings. The October 21 regular-session close of USD 284.65, multiplied by approximately 914 million period-end shares, implies equity value of USD 260.17 billion. Reported FCF yield is 3.24%; ex-incentive yield is 2.63%. Annualizing the Q4 EPS guidance midpoint of USD 2.62 gives USD 10.48 and a 27.2x multiple. This is a run-rate sensitivity, not an estimate of next year's earnings or a consensus multiple.
-
Analog is carrying the investment case. Analog generates 81.1% of revenue and 87.2% of operating profit. Its 51.0% operating margin creates room to fund Embedded Processing and manufacturing investment. Embedded's 26.5% margin remains much lower, so expansion into connectivity must produce incremental returns rather than simply enlarge the revenue base. The proposed Silicon Labs transaction adds a separate capital-allocation test.
-
The next quarter supports earnings durability rather than another sequential step change. Q4 revenue guidance has a USD 6.05 billion midpoint versus USD 6.055 billion in Q3; EPS midpoint is unchanged at USD 2.62. The central question has moved from whether demand has recovered to how much cash that demand can sustain through the cycle. A premium can persist, but another rerating requires better medium-term cash economics.
Our illustrative standalone next-year base case assumes revenue of USD 24.2 billion, a 46% operating margin, USD 280 million of net non-operating expense, a 13.5% tax rate and 925 million diluted shares. EPS is approximately USD 10.15: (24.2 × 46% − 0.28) × 86.5% / 0.925. Applying an analyst-selected 25–28x range produces USD 254–284 per share, placing the reference price at the upper boundary. These are transparent research assumptions, with no acquired earnings, purchase accounting or transaction financing included.
An optimistic sensitivity uses USD 26 billion revenue, 49% margin and 30x earnings with the same other assumptions, producing approximately USD 350 per share. A weaker cycle at USD 22 billion revenue, 40% margin and 22x produces approximately USD 175. These are scenario values rather than price targets. The asymmetry explains the cautious equity stance despite a positive view of the franchise: strong operations and attractive prospective returns are separate questions.
2. Company Overview, Business Mix, and Core Operating Metrics
Texas Instruments designs and manufactures chips that manage power, translate physical signals into usable data, and control electronic systems. Customers integrate these components into industrial machinery, vehicles, data centers, consumer devices and communications equipment. Revenue is earned through component shipments, with demand determined by customer production, semiconductor content and inventory decisions. The economic model therefore combines long product relevance with short-cycle ordering volatility.
Analog comprises power management and signal-chain products. Embedded Processing includes microcontrollers and processors, where software compatibility and development tools can help retain designs. Other contains remaining activities and certain corporate charges. A segment's reported profit should consequently be interpreted within its reporting definition; the high apparent Other margin does not identify a new high-margin product franchise.
|
Business / Q3 2026
|
Revenue, USD million
|
Revenue share
|
Operating profit, USD million
|
Economics and investment implication
|
|
Analog
|
4,911
|
81.1%
|
2,505
|
Power management and signal chain; principal source of manufacturing leverage. Operating margin 51.0%.
|
|
Embedded Processing
|
858
|
14.2%
|
227
|
Microcontrollers and processors; design and software ecosystems matter. Operating margin 26.5%.
|
|
Other
|
286
|
4.7%
|
142
|
Remaining activities and corporate items; includes acquisition and restructuring charges. Margin is not a clean product benchmark.
|
TI's business does not depend on a single annual device launch. Its portfolio spreads design risk across many applications, but breadth cannot eliminate a synchronized industrial downturn. The company's manufacturing ownership creates a second source of leverage: greater factory output spreads fixed costs across more shipments. The same mechanism reverses when loadings fall. The Q2 Form 10-Q explicitly describes this relationship, making utilization central to understanding the current margin rebound.
Core operating metrics and changes
|
Operating indicator
|
Latest disclosed value
|
Change / implication
|
|
Industrial demand
|
More than 40% YoY; about 10% QoQ
|
Strong cyclical rebound; do not equate sell-in with final consumption.
|
|
Automotive demand
|
Mid-teens YoY; about 10% QoQ
|
Broader demand support than data center alone.
|
|
Data center demand
|
About 95% YoY; about 20% QoQ
|
Fastest reported end-market growth; absolute revenue not supplied here.
|
|
Inventory
|
USD 4,672 million; 194 days
|
USD 67 million sequential increase; days down 2.
|
|
Q4 revenue guidance
|
USD 5.80–6.30 billion
|
USD 6.05 billion midpoint; approximately flat sequentially.
|
|
Q4 EPS guidance
|
USD 2.45–2.79
|
USD 2.62 midpoint; approximately flat sequentially.
|
|
Dividend
|
USD 1.52 quarterly; USD 6.08 annualized
|
7% increase; record date October 30; payment November 10.
|
The end-market growth rates come from the October 21 prepared remarks and are approximate management descriptions. They are not measured market-share changes. Industrial, automotive and data center all improved, which gives the recovery a broader foundation than a single AI category. However, TI did not supply a complete absolute end-market revenue split in these remarks. Assigning all incremental revenue to AI would therefore be unsupported.
Against the prior company outlook, revenue exceeded the USD 5.90 billion midpoint by USD 155 million, or 2.6%, while remaining below the USD 6.15 billion upper bound. EPS exceeded the USD 2.40 midpoint by USD 0.22, or 9.2%, and exceeded the upper bound of USD 2.57 by USD 0.05. These comparisons are to management guidance, not Wall Street consensus. The Q3 discrete tax surprise reduced EPS by USD 0.01 relative to the original outlook, so it does not explain the beat.
For the next quarter, the revenue midpoint is approximately flat sequentially. A strong year-over-year comparison can coexist with a flat sequential business; the latter is more relevant to near-term factory absorption. Investors should therefore distinguish a continuing recovery from an acceleration in the pace of recovery. The current outlook supports the first conclusion more clearly than the second.
3. Fundamental Quality
|
Financial metric, USD million except ratios/EPS
|
Q3 2025
|
Q2 2026
|
Q3 2026
|
|
Quarterly revenue
|
4,742
|
5,463
|
6,055
|
|
Quarterly GAAP operating profit
|
1,663
|
2,310
|
2,874
|
|
Quarterly GAAP operating margin
|
35.1%
|
42.3%
|
47.5%
|
|
Quarterly GAAP EPS, USD
|
1.48
|
2.14
|
2.62
|
|
Quarterly operating cash flow
|
2,190
|
2,703
|
3,419
|
|
TTM operating cash flow
|
6,897
|
8,667
|
9,896
|
|
TTM capital expenditures
|
4,817
|
3,300 (rounded)
|
2,578
|
|
TTM company-defined FCF
|
2,415
|
6,534
|
8,422
|
|
Cash plus short-term investments
|
5,186
|
Not reproduced
|
8,142
|
|
Debt, balance-sheet carrying value
|
14,046
|
Not reproduced
|
13,555
|
Periods are calendar quarters except TTM rows, which cover the twelve months ending each displayed quarter. Q2 capex is rounded as disclosed in the prior release. Debt in the table is carrying value, including current maturities; management separately reported USD 13.65 billion of principal outstanding in Q3. The two conventions should not be mixed. Cash includes short-term investments.
Growth quality is strong, with a cyclical component. Operating margin rose from 35.1% to 47.5% year over year. The exact Q3 gross margin is 3,887 / 6,055 = 64.2%; management rounded it to 64% in prepared remarks. Analog contributed USD 1.182 billion of the USD 1.313 billion revenue increase, approximately 90%. The chief driver is therefore the core franchise rather than a change in the composition of small activities. Nevertheless, extraordinary incremental margin signals operating leverage, not evidence that future revenue can keep converting at the same rate.
Cash conversion is strong, but the definition matters. TI defines FCF as operating cash flow less capital expenditures plus direct CHIPS proceeds. The TTM reconciliation is 9.896 − 2.578 + 1.104 = USD 8.422 billion. The USD 469 million tax-credit benefit is already included in operating cash flow; adding it again would double count it. Removing both forms of support gives 9.896 − 0.469 − 2.578 = USD 6.849 billion. This adjustment removes identified CHIPS cash benefits, not every possible government or tax effect.
The same calculation for the prior-year period is 6.897 − 0.302 − 4.817 = USD 1.778 billion. The USD 5.071 billion improvement in ex-incentive cash flow consists of USD 2.832 billion higher operating cash flow after tax-credit adjustment and USD 2.239 billion lower capex. Approximately 44% of the improvement thus came from reduced investment spending. That is valuable cash, but lower spending cannot supply the same incremental growth indefinitely. Eventually earnings and working-capital efficiency must carry more of the increase.
The balance sheet is manageable before the acquisition. Cash and short-term investments of USD 8.142 billion offset USD 13.555 billion of debt carrying value, giving net debt of USD 5.413 billion. This is moderate relative to current cash generation. However, acquisition consideration, fees and financing can consume liquidity even when operating leverage improves. February's approximately USD 7.5 billion enterprise-value announcement is not interchangeable with an exact future cash payment, and we do not mechanically subtract it from today's cash balance.
Capital returns are covered at the recent trailing rate: USD 5.810 billion returned to owners represents 84.8% of analytical ex-incentive FCF. The annualized new dividend of USD 6.08 implies approximately USD 5.56 billion of payments on 914 million shares, before future changes in shares or declaration decisions. That alone consumes around 81% of the adjusted trailing cash base. The dividend looks supportable, while the remaining capacity for buybacks, acquisition financing and another capex expansion is less generous than the reported FCF headline suggests.
The most important variable is sustained utilization translating into cash earnings per share. An explicit sensitivity illustrates the mechanism: an additional USD 1 billion of revenue at an assumed 55% incremental operating margin adds USD 550 million of operating profit. At a 13.5% tax rate and 925 million diluted shares, that is about USD 0.51 of EPS. At a 27x earnings multiple it supports roughly USD 13.9 per share of value, provided working capital and capex do not absorb the benefit. The incremental margin is an analytical assumption, below the exceptional current comparison; the calculation is not company guidance.
For cash flow, that same USD 476 million after-tax operating contribution is an upper starting point before incremental working capital and equipment spending. A USD 200 million inventory and receivables build would reduce the cash benefit to approximately USD 276 million. This is why tracking shipments alongside inventory and investment is more useful than extrapolating EPS alone. The transmission chain is demand, shipments, factory absorption, after-tax profit, cash conversion, then valuation.
4. Industry and Competitive Landscape
The relevant industry is analog, embedded control and associated power and connectivity semiconductors. It overlaps AI infrastructure through power delivery and sensing, but the competitive set differs from leading compute accelerators. Customers choose components for performance, reliability, software support, availability and total system cost. The investor question is how much economic value each supplier retains once its manufacturing and development commitments are funded.
|
Competitive arena
|
Evidence / scale
|
Relative position
|
Valuation implication
|
|
Broad analog manufacturing
|
TI Analog revenue USD 4.911 billion; 51.0% segment operating margin
|
TI benefits from utilization; ADI competes through higher-value mixed signal
|
A premium needs durable cash returns after factory spending.
|
|
Industrial recovery
|
TI industrial above 40% growth; ADI industrial 53%
|
Both are winners in disclosed periods; timing and categories differ
|
Sector recovery does not establish TI share gains.
|
|
Automotive / embedded
|
NXP automotive USD 1.938 billion; TI Embedded USD 858 million
|
NXP stronger in disclosed automotive scale; metrics are not equivalent markets
|
TI needs connectivity returns rather than acquisition scale alone.
|
|
Margin resilience
|
ST gross margin 34.8%; TI 64.2%; ADI 67.3%
|
ST lags these peers in gross profitability in the compared periods
|
TI is a net beneficiary, but portfolio differences prevent causal ranking.
|
|
Company / reported period
|
Revenue, USD billion
|
Revenue growth YoY
|
GAAP gross margin
|
GAAP operating margin
|
Cash / operating evidence
|
|
Texas Instruments Incorporated / Q3 2026
|
6.055
|
28%
|
64.2%
|
47.5%
|
TTM FCF USD 8.422 billion; includes CHIPS benefits.
|
|
Analog Devices, Inc. / Q3 FY2026, ended Aug. 1
|
4.022
|
40%
|
67.3%
|
40.1%
|
TTM FCF USD 4.937 billion; operating cash flow less capex.
|
|
NXP Semiconductors N.V. / Q2 2026, ended June 28
|
3.496
|
19%
|
57.3%
|
30.6%
|
Quarterly FCF USD 791 million; net capex convention.
|
|
STMicroelectronics N.V. / Q2 2026
|
3.490
|
26%
|
34.8%
|
Not used
|
Official headline data only; Q3 reporting scheduled Oct. 29.
|
Peer periods are the latest financial releases verified for this comparison, not identical calendar windows. All displayed margins are GAAP; ADI's 50.0% adjusted operating margin and NXP's 35.1% non-GAAP operating margin are deliberately not substituted into the GAAP column. Cash-flow definitions and time windows differ, so absolute FCF figures are context rather than a ranking. No precise current market-share dataset or peer valuation consensus is assumed.
TI and ADI are the clearest operating winners in the compared disclosures. TI combines a large analog business with exceptional incremental absorption. ADI grows faster from a different base and produces a higher gross margin, supporting the view that specialized mixed-signal capability remains valuable even as manufacturing capacity expands. Neither observation proves that TI is taking share from ADI. Their product mixes and reported periods differ, and both may be benefiting from the same restocking and demand cycle.
NXP is a credible competitor in embedded and automotive systems. Its disclosed automotive scale illustrates why TI cannot treat connectivity as an uncontested extension. The proposed Silicon Labs acquisition may broaden the portfolio, but the economic hurdle includes the capital used, integration work and the time required to migrate manufacturing or cross-sell designs. Announced annual manufacturing and operational synergies of roughly USD 450 million within three years after closing are a management objective. They should not be booked into current earnings or assumed available on day one.
ST is the relative laggard in current gross profitability. Its disclosed 34.8% gross margin is substantially below TI and ADI despite revenue growth. This makes it the weaker operating comparison in the selected windows, rather than evidence that all its products or future investments are structurally inferior. A lower gross margin can reflect mix and utilization as well as competitive pressure. A permanent market-share-loss claim would require evidence not available here.
TI is a net beneficiary of the current recovery because its installed manufacturing footprint amplifies incremental demand. The strategic advantage is strongest when reliable capacity supports profitable design positions. It weakens if capacity must be filled with lower prices or customers use supply alternatives to bargain away the gains. The market can reward a manufacturing moat, but shareholder returns ultimately require that moat to generate cash after replacement and expansion spending.
5. Key Risks
-
Restocking reverses. If industrial orders slow after customer inventories normalize, shipments can fall faster than final equipment production. Lower loadings would spread fixed costs over fewer units and compress both earnings and cash conversion. Continued positive year-over-year growth would not by itself invalidate this risk.
-
Factory spending rises again. If demand requires substantially more equipment or qualification spending, capex can absorb the cash now released by the investment slowdown. A higher reported operating margin could then coexist with a disappointing ex-incentive FCF yield, weakening the valuation case.
-
Government support is mistaken for recurring operating capacity. A reduction or delay in direct proceeds and tax-credit utilization would lower reported cash availability. The analytical adjustment already removes identified benefits, but investors pricing the larger headline may still react to their disappearance.
-
Connectivity acquisition returns fall short. Regulatory delay, integration expense, customer attrition or weaker synergies could postpone returns on the proposed Silicon Labs investment. Cash and financing commitments would become more burdensome relative to the earnings acquired, limiting buybacks and valuation flexibility.
-
Price competition absorbs the manufacturing advantage. If customers demand concessions or competing capacity becomes more available, revenue growth may fail to sustain gross margin. The effect would flow from price and mix into factory economics, earnings and the premium multiple.
-
Inventory becomes a drag. If inventory rises while shipment growth slows, working capital can consume cash even before an income-statement downturn. A later write-down or production cut would add a second hit to profitability. The 194-day starting point warrants attention despite the sequential decline in days.
-
The premium multiple compresses. At roughly 27x a strong quarterly EPS run rate, even unchanged earnings can produce weak equity returns if investors demand a higher cash yield. Futures users face additional funding, basis and liquidation effects; stock-level fundamental scenarios do not model their leveraged returns.
6. Monitoring Checklist
The following thresholds are research decision rules, not management targets or trading instructions.
-
Q4 revenue and EPS: delivery at or above USD 6.05 billion and USD 2.62 supports the durability case; outcomes below USD 5.80 billion or USD 2.45 would materially weaken it. Review tax effects before attributing an EPS variance to operations.
-
Gross margin and factory absorption: maintaining approximately 64% with stable revenue supports structural operating progress. A decline below 60% without a clear temporary explanation would argue that the latest economics were too cyclical to capitalize at a premium.
-
Industrial and automotive demand: sustained positive sequential growth in both strengthens the breadth of recovery. Two sequential declines in industrial revenue would be a warning even if data-center revenue remains strong. Avoid imposing invented absolute AI revenue estimates.
-
Ex-incentive TTM cash flow: maintaining at least USD 6.8 billion while funding planned operations supports the current baseline. An increase above USD 8 billion without a new capex deferral would improve the equity case; a fall below USD 6 billion would weaken dividend and acquisition headroom.
-
Inventory: a move below 180 days with stable service supports genuine absorption. A rise above 210 days alongside slower revenue would signal that shipments and cash quality are diverging. These are directional thresholds, not sector-wide norms.
-
Capital allocation: reassess coverage against the approximately USD 5.56 billion annualized dividend burden and actual acquisition funding. A combined distribution and financing requirement above recurring cash generation would weaken the premium thesis, even with accounting accretion.
-
Peer and filing checks: use ST's scheduled October 29 results to test the breadth of recovery, and TI's next quarterly filing to verify working capital, incentives and transaction commitments. No unverified TI Q4 reporting date is assigned. Dividend record and payment dates are October 30 and November 10.
Material data boundaries
The reference price is the October 21 regular-session close, preceding the earnings release; it is not represented as a fully informed post-results equilibrium. Recalculate yields and scenario comparisons if the share price changes materially. Market capitalization uses approximate period-end shares, while EPS sensitivities use an explicitly assumed diluted share count. No current consensus or unpublished Q3 10-Q is assumed.
The LBank TXNUSDT trading interface was opened and its contract and order controls were observed alongside official listing and trading-hours notices. Mark/index prices and volume were not populated in the unauthenticated text response, so this report does not verify a live futures quote, liquidity or order executability. The derivative is separate from ownership of the underlying Nasdaq-listed shares; all stock valuation arithmetic uses the independent equity reference price. AMDON and COSTON interfaces were also opened before final selection; both companies were already covered within 90 days, while TXN's prior coverage was July 23, 91 calendar days earlier.
7. Sources
-
-
Q3 2026 Earnings Call Prepared Remarks (https://investor.ti.com/static-files/b012c095-ee25-4280-970f-728ceed4af7b) — October 21, 2026; official prepared remarks, end markets, inventory, debt principal and outlook. Web reader available; direct download returned 403.
-
-
Form 10-Q for Texas Instruments INC filed 07/24/2026 (https://investor.ti.com/static-files/5ba0db09-a2a1-4227-bddd-5e979ff610ce) — Quarter ended June 30, 2026; official search-index text verified; direct PDF access returned 403. Used for fixed-cost economics and acquisition financing, not as a Q3 filing.
-
-
Texas Instruments to acquire Silicon Labs (https://investor.ti.com/news-releases/news-release-details/texas-instruments-acquire-silicon-labs) — February 4, 2026; announced transaction terms and synergy objective. Proposed transaction; not treated as completed.
-
Investor relations | TI.com (https://investor.ti.com/) — October 15 dividend declaration and September 17 dividend increase; checked October 22, 2026.
-
-
NXP Semiconductors Reports Second Quarter 2026 Results (https://investors.nxp.com/news-releases/news-release-details/nxp-semiconductors-reports-second-quarter-2026-results/) — July 28, 2026; quarter ended June 28; GAAP comparison. The release identifies divestiture-related distortion in Q1 profitability.
-
Investor Relations - STMicroelectronics (https://investors.st.com/) — Official Q2 2026 key facts: revenue USD 3.49 billion, growth 26%, gross margin 34.8%; search-index text verified; direct homepage returned 403.
-
-
TXN Historical Prices | ChartExchange (https://chartexchange.com/symbol/nasdaq-txn/historical/) — October 21, 2026 regular-session reference close USD 284.65; secondary price source. No after-hours execution price or consensus estimate is assumed.
-
TXNUSDT Futures Trading | LBank Futures (https://www.lbank.com/futures/txnusdt) — Opened with web reader and command-line HTTP on October 22; TXNUSDT Perp, order book, isolated/cross controls and Open Long/Open Short interface present. Live mark/index prices and volume were unavailable; no live futures quote or executable liquidity is verified.
-
-
Trading Hours Update & Funding Fee Activation – PDDUSDT, TXNUSDT (https://www.lbank.com/support/articles/2071789002486185984) — June 30, 2026; official continuation and 24/7 funding mechanism. No subsequent TXN delisting announcement was found in the October 22 search; absence of a search result does not establish executable liquidity.
-
AMDON/USDT Spot Trading | LBank (https://www.lbank.com/trade/amdon_usdt) — Candidate interface opened October 22 by web reader and direct HTTP; nonzero token quote and turnover, Buy/Sell interface. AMD excluded by 90-day coverage rule.
-
-
COSTON/USDT Spot Trading | LBank (https://www.lbank.com/trade/coston_usdt) — Candidate interface opened October 22; nonzero token quote and turnover, Buy/Sell interface. COST excluded by 90-day coverage rule.
-



 Transfer