Author: LBank Research Analyst: Ludo
Trading-pair note: MRVLON is the Ondo tokenized version of Marvell Technology and provides economic exposure designed to resemble holding MRVL with dividends reinvested. It is a tokenized product rather than Marvell common stock, and eligibility, custody, liquidity and redemption conditions may differ from those of Nasdaq-listed MRVL.
Disclaimer: This report is compiled and analyzed from publicly available information and is intended solely for information sharing and research discussion. It does not constitute investment advice, a securities recommendation, a trading instruction, or any guarantee of returns. The company operations, valuations, market prices, and consensus expectations discussed herein may change over time. Readers should independently verify the data and make their own decisions.
1. Core Conclusion
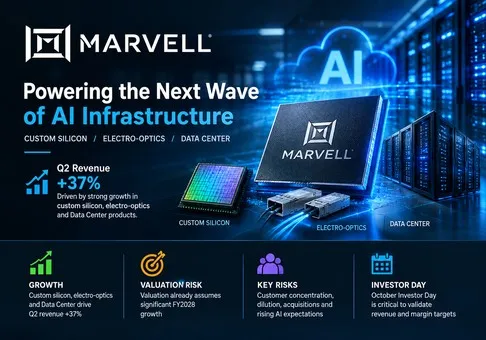
Overall judgment: Marvell is becoming a higher-quality AI infrastructure supplier as custom silicon and connectivity scale together, but MRVL looks overextended at USD 223.55: the equity is valued at roughly 17.2 times management's fiscal 2027 revenue outlook and 11.5 times its fiscal 2028 outlook, leaving an unfavorable near-term risk-reward balance unless the October Investor Day reveals materially better margin or revenue economics.
-
The AI growth is real and broadening. Fiscal Q2 2027 revenue rose 37% year over year to USD 2.739 billion, while Data Center revenue rose 46% to USD 2.172 billion and reached 79% of sales. Management guided fiscal Q3 revenue to USD 3.150 billion at the midpoint, implying another 15% sequential step-up. This is no longer a recovery driven by one product category: the company attributes demand to electro-optics, custom silicon, storage and switching. The investment implication is that Marvell deserves a structural growth premium over traditional communications-semiconductor peers.
-
The second half now carries most of the valuation burden. First-half fiscal 2027 revenue was USD 5.157 billion. To reach management's roughly USD 12 billion full-year outlook, the second half must deliver about USD 6.843 billion, or USD 3.422 billion per quarter. The Q3 midpoint supplies USD 3.150 billion, leaving about USD 3.693 billion for Q4. That is achievable if custom programs accelerate as promised, but it makes execution rather than demand rhetoric the key stock variable.
-
The Google agreement validates Marvell's position while transferring meaningful economics to the customer. Google can earn up to 58.97 million warrant shares at USD 206.58. The performance-based portion vests in 240 tranches, one per USD 500 million of qualifying custom-product revenue, which mathematically corresponds to as much as USD 120 billion of cumulative purchases. Full issuance would equal about 6.4% of Marvell's Q2 diluted share count. The agreement is powerful evidence of lifetime program scale, yet investors must measure revenue growth per diluted share rather than celebrate the headline contract alone.
-
Cash generation is improving, but it does not yet support the market value. First-half operating cash flow was USD 1.244 billion and capital expenditure was USD 282 million, producing approximately USD 962 million of free cash flow. Annualizing that amount gives about USD 1.92 billion, against an enterprise value near USD 207 billion. The resulting valuation above 100 times annualized first-half free cash flow requires rapid conversion of the custom and connectivity ramp into operating leverage.
-
The premium already assumes a large portion of fiscal 2028 success. Using the September 4 close, Q2 diluted shares and net debt gives an estimated enterprise value of USD 207 billion. That is 11.5 times management's USD 18 billion fiscal 2028 revenue outlook. In an illustrative case with a 36% non-GAAP operating margin, an 11% tax rate and 980 million diluted shares, fiscal 2028 earnings would be approximately USD 5.88 per share; the current price would still equal about 38 times that two-year-forward earnings power. The stock needs upside beyond the current revenue guide, sustainably higher margins, or both.
The next decisive catalyst is Marvell's October 6, 2026 Investor Day. The market needs program-level timing, custom-silicon margin structure, connectivity mix and a credible bridge from USD 12 billion to USD 18 billion of revenue. A restatement of the existing growth targets would be insufficient at the current valuation.
2. Company Overview, Business Mix, and Core Operating Metrics
Marvell is a fabless semiconductor company focused on data infrastructure. It designs complex system-on-chip products and analog, mixed-signal and digital-signal-processing components, while external foundry and assembly partners manufacture the chips. Its economics depend on design wins, product ramps and customer deployment schedules. Upfront research and development spending can precede production revenue by several years, especially in custom accelerators.
The portfolio spans custom compute, high-speed optical and electrical connectivity, Ethernet switching, network interface controllers, data-processing products, storage controllers and security silicon. Custom products are developed with hyperscale customers and can generate large, concentrated revenue streams once deployed. Connectivity products monetize the bandwidth and power bottlenecks created by ever-larger AI clusters. Storage and traditional communications products add breadth but are less central to the current valuation narrative.
|
Business exposure
|
Q2 FY2027 revenue
|
Mix
|
Growth and economics
|
|
Data Center
|
USD 2.172 billion
|
79%
|
Up 46% year over year; includes custom silicon, electro-optics, storage and switching. This is the primary source of growth and valuation.
|
|
Communications and Other
|
USD 568 million
|
21%
|
Up 10% year over year as customer inventories normalized; partially offset by the divested automotive Ethernet business.
|
Marvell formally reports only these two end markets, so any more granular product mix would be an estimate. The Data Center category is nonetheless economically diverse. Connectivity can ramp across many accelerator platforms, while custom silicon is tied to individual customer programs. That diversification within one reported segment improves the durability of growth, although the customer base remains concentrated.
Core Operating Metrics and Recent Changes
|
Metric or event
|
Latest result
|
Comparison
|
Investment meaning
|
|
Q2 FY2027 revenue
|
USD 2.739 billion
|
Up 37% year over year
|
The AI ramp is producing company-wide acceleration.
|
|
GAAP and non-GAAP gross margin
|
53.1% and 58.9%
|
GAAP up 270 basis points year over year
|
Scale and mix offset some custom-silicon margin pressure.
|
|
GAAP and non-GAAP diluted EPS
|
USD 0.33 and USD 0.94
|
Non-GAAP up 40% year over year
|
Earnings are scaling faster than revenue, but exclusions remain large.
|
|
Q3 FY2027 guide
|
USD 3.150 billion revenue
|
Plus or minus 5%
|
The midpoint requires continued Data Center acceleration.
|
|
Google warrant
|
58.97 million shares at USD 206.58
|
Up to 6.4% of Q2 diluted shares
|
Validates a large customer relationship while creating performance-linked dilution.
|
|
October Investor Day
|
October 6, 2026
|
Next major catalyst
|
Needs to supply a more detailed revenue, margin and program bridge.
|
The largest accounting gap is between GAAP and non-GAAP earnings. Q2 stock-based compensation was USD 326 million and acquired-intangible amortization was USD 215 million. These are economically relevant: equity compensation dilutes owners, while acquired technology is part of the asset base required to generate revenue. Non-GAAP figures are useful for operating momentum, but valuation should include dilution and acquisition costs.
3. Fundamental Quality
Marvell's fundamental quality has improved sharply. Revenue growth is strong, GAAP operating margin has turned positive, and free cash flow is rising. The balance sheet remains manageable, but acquisitions have increased goodwill, debt and share count. The company is converting from a diversified infrastructure-chip supplier into an AI-focused platform, which raises both its growth ceiling and its concentration risk.
|
Metric
|
FY2024
|
FY2025
|
FY2026
|
H1 FY2027
|
|
Revenue
|
USD 5.508 billion
|
USD 5.767 billion
|
USD 8.195 billion
|
USD 5.157 billion
|
|
GAAP gross margin
|
41.6%
|
41.3%
|
51.0%
|
52.7%
|
|
GAAP operating income
|
USD (568) million
|
USD (720) million
|
USD 1.323 billion
|
USD 799 million
|
|
Operating cash flow
|
USD 1.371 billion
|
USD 1.681 billion
|
USD 1.751 billion
|
USD 1.244 billion
|
|
Capital expenditure
|
USD 336 million
|
USD 285 million
|
USD 354 million
|
USD 282 million
|
|
Free cash flow, calculated
|
USD 1.034 billion
|
USD 1.397 billion
|
USD 1.396 billion
|
USD 962 million
|
|
Cash and debt
|
Not shown
|
USD 0.948 billion and USD 4.434 billion
|
USD 2.639 billion and USD 4.471 billion
|
USD 3.933 billion and USD 4.963 billion
|
Free cash flow equals operating cash flow less purchases of property and equipment. Fiscal 2026 GAAP net income included a USD 1.830 billion pre-tax gain on the automotive Ethernet divestiture, so operating income and cash flow are better measures of recurring progress than net income for that year.
Growth quality is strong because Data Center revenue, gross margin and operating income are rising together. Cash conversion is acceptable for a fabless model but is temporarily burdened by working capital and capacity commitments. Supply-capacity prepayments increased to USD 487 million by Q2. Inventory was stable at USD 1.361 billion, reducing immediate evidence of an inventory problem even as the revenue base expands.
The balance sheet is adequate rather than pristine. Net debt was only about USD 1.0 billion at Q2, but goodwill and acquired intangibles totaled USD 16.2 billion after the Celestial AI and XConn acquisitions. Those transactions expand Marvell into optical scale-up and PCIe/CXL switching, yet they also raise integration and return-on-capital risk. The USD 3.534 billion Celestial purchase price is especially material relative to current free cash flow.
The single most important variable is the pace and margin of custom-silicon revenue in fiscal 2028. Connectivity can support high gross margins, while large custom programs may bring lower gross margin but substantial operating leverage. Investors need segment-level evidence that the combined mix can sustain non-GAAP operating margins in the mid-30% range or better.
The operating bridge is explicit. Fiscal 2027 revenue of USD 12 billion requires USD 6.843 billion in the second half. If Q3 reaches USD 3.150 billion, Q4 must reach about USD 3.693 billion. At the Q3 non-GAAP gross-margin midpoint of 58.0%, gross profit would be USD 1.827 billion. Subtracting guided non-GAAP operating expenses of USD 655 million implies about USD 1.172 billion of operating income, a 37.2% margin. Holding that margin near 36% on fiscal 2028 revenue of USD 18 billion would produce USD 6.48 billion of operating income. After an illustrative 11% tax rate and across 980 million diluted shares, earnings would be about USD 5.88 per share. This chain shows why the revenue ramp must arrive with operating leverage: at today's price, even that outcome leaves a demanding multiple.
4. Industry and Competitive Landscape
Marvell competes across two linked AI infrastructure layers. The first is custom compute, where hyperscalers commission accelerators and controllers optimized for their own workloads. The second is scale-up and scale-out connectivity, where optical DSPs, Ethernet switching, retimers and interfaces move data among accelerators, memory and storage. The value pool is expanding because cluster size, bandwidth and power constraints grow faster than accelerator count.
|
Layer
|
Marvell position
|
Principal competitors
|
Valuation implication
|
|
Custom AI accelerators
|
Credible challenger with Google-linked programs and multiple hyperscale relationships
|
Broadcom, in-house hyperscaler teams, NVIDIA ecosystem
|
Large lifetime revenue, but customer bargaining power and warrant dilution reduce per-share economics.
|
|
Electro-optics
|
Strong merchant portfolio across PAM DSPs and emerging photonics
|
Broadcom, Credo and internal solutions
|
High bandwidth growth can sustain premium margins if Marvell preserves share.
|
|
Scale-up and scale-out switching
|
Expanding through XConn, UALink and NVIDIA interoperability
|
NVIDIA, Broadcom, Astera Labs
|
Design wins could create upside beyond current custom programs, but timing remains early.
|
|
Storage and controllers
|
Established controller and infrastructure IP
|
Broadcom, Intel and specialist vendors
|
Adds attach revenue and customer breadth, but carries less valuation weight than AI compute and connectivity.
|
|
Company
|
Latest quarterly revenue
|
Growth
|
|
Competitive reading
|
|
Marvell
|
USD 2.739 billion
|
37%
|
53.1%
|
Data Center reached 79% of sales; the challenger is gaining relevance across compute and connectivity.
|
|
Broadcom
|
USD 29.591 billion
|
86%
|
Not directly comparable
|
Q3 AI semiconductor revenue was USD 16.7 billion, up 221%; Broadcom is the current custom-silicon scale winner.
|
|
NVIDIA
|
USD 96.221 billion
|
106%
|
75.0%
|
Data Center revenue of USD 89.0 billion makes NVIDIA the integrated compute and networking winner.
|
|
Credo
|
USD 479 million
|
115%
|
64.5%
|
A faster-growing connectivity specialist with higher gross margin and narrower breadth.
|
|
Intel
|
USD 16.128 billion
|
25%
|
40.4%
|
DCAI recovered, but Intel remains the relative loser in merchant AI accelerators because its disclosed momentum centers on CPUs and partner-based systems.
|
Periods are the closest reported quarters available as of September 7, 2026 and fiscal calendars differ. Broadcom includes infrastructure software, NVIDIA includes multiple platforms, Intel includes manufacturing, and Credo is a narrower connectivity vendor; revenue and margins are therefore directional comparisons rather than normalized peer multiples.
Broadcom and NVIDIA are winning the industry's largest economics today. Broadcom has the custom-accelerator scale, while NVIDIA controls the integrated platform. Credo is winning a focused connectivity niche. Marvell is a net beneficiary of the move toward heterogeneous AI clusters because it can sell both custom compute and the connectivity surrounding every accelerator. Its disadvantage is that it remains far smaller than Broadcom and NVIDIA and must grant meaningful customer incentives to secure the largest programs. Intel is the relative loser in merchant AI accelerators despite a strong DCAI recovery, as its current growth does not demonstrate a comparable proprietary accelerator franchise.
Marvell's differentiated opportunity is to become the neutral infrastructure partner across GPU and custom-ASIC deployments. The NVIDIA partnership supports interoperability, while the Google agreement expands custom exposure. If heterogeneous systems become the norm, Marvell can monetize more nodes without needing one compute architecture to dominate. If customers consolidate spending with Broadcom or build more functions internally, the same openness becomes a weaker moat.
5. Key Risks
-
Custom-program delay or cancellation. If Q4 fiscal 2027 revenue falls materially below the roughly USD 3.69 billion implied by the annual outlook, investors would likely question the timing of the custom ramp. Lower revenue would reduce fixed-cost absorption, pressure operating margin and compress the sales multiple.
-
Customer concentration. One distributor represented 44% of Q2 revenue and one direct customer represented 16%; four customers represented 72% of gross receivables. A design loss, purchase deferral or customer inventory correction could therefore create a disproportionate revenue and cash-flow decline.
-
Warrant and equity dilution. The Google warrant covers up to 58.97 million shares, while NVIDIA's preferred investment can convert into about 21.8 million shares. If the programs succeed, per-share value will be spread over a larger base. If they underperform, Marvell may have granted incentives without earning sufficient incremental return.
-
Gross-margin mix pressure. Custom silicon can carry lower gross margin than merchant connectivity. A sustained non-GAAP gross margin below 57.5%, the low end of Q3 guidance, would weaken the operating-leverage thesis and make the current valuation harder to justify.
-
Acquisition integration and capital allocation. Celestial AI and XConn added roughly USD 4.0 billion of purchase consideration. Delayed photonics or switching commercialization would leave Marvell with high goodwill, amortization and research spending without the expected revenue, reducing return on invested capital.
-
Supply-chain dependence. Marvell relies on a limited set of foundry, substrate, assembly and test partners. Capacity shortages or unfavorable allocation could delay ramps just as customer demand accelerates, shifting revenue out while research and development costs remain.
-
Export and geographic risk. Shipments to China represented 42% of Q2 revenue, although the company notes that destination does not necessarily identify the end customer. Tighter controls, tariffs or customer relocation could disrupt logistics, limit products or raise cost.
-
AI capital-spending normalization. Data Center is 79% of sales. A slowdown in hyperscaler capital expenditure, power constraints or more efficient AI models would reduce demand across custom, optical, storage and switching products simultaneously, turning the current concentration from a strength into a cyclical risk.
-
Valuation compression. At about 17.2 times fiscal 2027 revenue and 11.5 times fiscal 2028 revenue, modest execution misses can cause a large stock move even if absolute growth remains strong. The 10% decline after the August 28 trading session illustrates this sensitivity.
6. Monitoring Checklist
-
Fiscal Q3 revenue: Above USD 3.15 billion reinforces the second-half ramp; below the USD 2.99 billion low end would materially weaken it.
-
Fiscal Q4 implied revenue: A guide near or above USD 3.69 billion supports the USD 12 billion annual target. A guide below USD 3.5 billion would require reassessing the timing of custom revenue.
-
Data Center growth: Sustained year-over-year growth above 45% supports the premium; a drop below 30% would signal that expectations are outrunning deployments.
-
Non-GAAP gross margin: Holding at or above 58% would show mix resilience. A decline below 57.5% would imply that custom growth is diluting economics faster than scale can offset.
-
Non-GAAP operating margin: A level near the 37% implied by Q3 guidance would validate operating leverage. Falling below 33% as revenue accelerates would weaken the earnings bridge.
-
October Investor Day: Look for explicit fiscal 2028 custom, connectivity and total revenue bridges, plus long-term margin targets. Repeating USD 18 billion without program timing would not resolve the main valuation question.
-
Google warrant vesting and revenue: Track vested shares and qualifying purchase revenue together. Dilution is acceptable only if revenue and profit per diluted share grow proportionately.
-
Free cash flow: A rolling 12-month free-cash-flow margin above 20% would strengthen quality. Remaining near the first-half annualized level while revenue approaches USD 12 billion would indicate weak conversion.
7. Sources
-
-
-
-
-
-
-
-
-
Broadcom Q3 fiscal 2026 results (https://investors.broadcom.com/news-releases/news-release-details/broadcom-inc-announces-third-quarter-fiscal-year-2026-financial)
-
NVIDIA Q2 fiscal 2027 results (https://investor.nvidia.com/news/press-release-details/2026/NVIDIA-Announces-Financial-Results-for-Second-Quarter-Fiscal-2027/default.aspx)
-
Credo Q1 fiscal 2027 results (https://investors.credosemi.com/news-events/news/news-details/2026/Credo-Technology-Group-Holding-Ltd-Reports-First-Quarter-of-Fiscal-Year-2027-Financial-Results/default.aspx)
-
Intel Q2 2026 results (https://www.intc.com/news-events/press-releases/detail/1776/intel-reports-second-quarter-2026-financial-results)