Author: LBank Research Analyst: Ludo
Disclaimer: This report is compiled and analyzed from publicly available information and is intended solely for information sharing and research discussion. It does not constitute investment advice, a securities recommendation, a trading instruction, or any guarantee of returns. The company operations, valuations, market prices, and consensus expectations discussed herein may change over time. Readers should independently verify the data and make their own decisions.
1. Core Conclusion
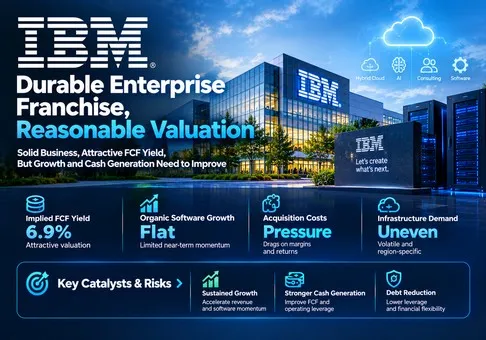
Overall judgment: IBM remains a durable enterprise franchise, and its valuation is reasonable with a modest positive risk-reward bias; a sustained premium requires organic software growth and financing-adjusted cash generation to recover. At the October 20 NYSE close of USD 241.92, reported equity value was USD 227.92 billion. Against the roughly USD 15.7 billion of 2026 company-defined FCF implied by management's outlook, this is 14.5x cash flow and a 6.9% cash-flow yield. That supports a value case, but it leaves substantial dependence on year-end execution.
This is a pre-results fundamental review with an information cutoff of October 21, 2026, 12:10 China time. IBM's Q3 conference call is scheduled for October 21 at 5:00 PM ET, or October 22 at 5:00 AM China time. Q3 results are not included. The equity valuation concerns International Business Machines Corporation, NYSE: IBM; IBMON is the separately traded Ondo tokenized product. Its exchange quote is not used in the valuation.
-
Cash earnings support the valuation, with limited immediate rerating in the base case. Applying a research-assumed 15x multiple to USD 15.7 billion FCF gives USD 235.5 billion equity value, or approximately USD 249.97 per share using 942.13 million shares. This is about 3.3% above the reference close before dividends. The model supports a measured positive view rather than a high-growth software premium.
-
The software moat is stronger than the headline growth quality. Reported software growth was 5%, but organic growth was flat. The recurring base helps protect durability; purchased revenue cannot alone justify multiple expansion. A return to positive organic growth is the most useful test of whether delayed transactions are being recovered.
-
Headline operating cash flow overstates the improvement in underlying cash performance. H1 GAAP operating cash flow rose 27.9%, while IBM-defined FCF slipped 1.0%. Financing-receivable movements explain much of the difference. Valuation should reward durable customer economics rather than a temporary release of financing assets.
-
The portfolio has several genuine growth engines, but the mainframe ecosystem remains a constraint. Red Hat grew 11% at constant currency, while Transaction Processing fell 9% on the same basis. Equipment and associated licenses can move together when customer budgets shift. Subscription resilience reduces the damage without removing the timing exposure.
-
Capital allocation is the second gate to shareholder returns. H1 acquisitions consumed about USD 10.5 billion and June core debt was USD 48.9 billion. Integration, debt reduction and returns on new investment matter more than the number of AI announcements. Recent product and venture activity earns strategic attention but receives no separate speculative valuation in this report.
The valuation scenarios are explicit research assumptions, not consensus, company guidance on equity value, or price targets. A downside case of USD 13.0 billion FCF at 13x gives roughly USD 179.38 per share; a constructive case of USD 17.0 billion at 17x gives USD 306.75. Both use a constant share count and ignore interim cash distributions, debt changes and timing. These deliberately broad scenarios show the sensitivity to cash durability and investor confidence. The base case is more credible than the constructive case because the latest organic software result was flat.
A reproducible operating bridge explains why a modest growth recovery matters. Annualizing Q2 software revenue gives 4 × USD 7.761 billion = USD 31.044 billion. An additional 3 percentage points of annual growth on that illustrative base adds USD 0.931 billion revenue. Assuming a 35% incremental pre-tax contribution, a 20% tax rate and 90% cash conversion after incremental capital needs gives about USD 0.235 billion incremental annual FCF. At 15x, that represents USD 3.52 billion equity value, or about USD 3.74 per share. This is a sensitivity calculation, not a revenue forecast; seasonality, acquisitions and the cost of winning business could change every conversion step.
2. Company Overview, Business Mix, and Core Operating Metrics
IBM sells the software, implementation expertise and computing infrastructure that large organizations use to run critical workflows. Customers include enterprises with complex legacy systems, regulated data and demanding availability requirements. Revenue comes from recurring subscriptions and support, consumption, software licenses, consulting engagements, managed operations, equipment and financing. The investment case depends on how these revenue streams reinforce one another and how much additional selling and delivery effort they require.
Red Hat supplies an application and infrastructure foundation across customer-controlled and public-cloud environments. Automation and Data address the management of technology operations and enterprise information. Transaction Processing monetizes mission-critical software, much of it associated with mainframe workloads. Consulting helps implement and operate these systems. Infrastructure supplies IBM Z, Power, Storage and support. Financing facilitates client purchases and is economically distinct from the software cash engine.
Business structure
|
Business
|
Q2 revenue, USD billion
|
Revenue share
|
Segment profit margin
|
Business model
|
|
Software
|
7.761
|
45.2%
|
32.2%
|
Red Hat, Automation, Data and Transaction Processing; subscriptions, consumption, licenses and support.
|
|
Consulting
|
5.327
|
31.0%
|
12.1%
|
Strategy and Technology plus Intelligent Operations; project delivery and managed services.
|
|
Infrastructure
|
3.835
|
22.3%
|
21.8%
|
IBM Z, Power, Storage and infrastructure support; equipment cycles plus service annuities.
|
|
Financing
|
0.186
|
1.1%
|
58.0%
|
Client financing; profit includes intercompany items eliminated in consolidation.
|
|
Other
|
0.052
|
0.3%
|
Not applicable
|
Corporate and other revenue; rounding prevents shares summing precisely to 100%.
|
Shares use consolidated revenue of USD 17.162 billion. Segment profit is a management measure before corporate reconciliation and does not equal consolidated operating income. Financing includes intercompany activities; its margin should not be interpreted as an external lending spread or compared directly with software profitability. Software produced USD 2.502 billion segment profit, versus USD 0.647 billion in Consulting and USD 0.835 billion in Infrastructure; its importance to earnings exceeds its revenue share.
The commercial attraction is installed-base access. A vendor that understands application dependencies, security controls and transaction requirements can sell adjacent software with less implementation risk. The practical constraint is customer budget allocation: a critical workload may remain in place while the customer delays an upgrade, a large license agreement or a transformation project. Technical retention therefore does not guarantee smooth quarterly revenue.
Core operating metrics and changes
|
Indicator
|
Latest verified observation
|
Investment interpretation
|
|
Software growth
|
+5% reported; flat organic
|
Acquisitions supported expansion; demand quality requires organic improvement.
|
|
Recurring software
|
About 80%; ARR USD 24.6 billion, +8%
|
ARR annualizes current recurring revenue; acquisition contribution prevents a purely organic reading.
|
|
Red Hat / Data / Automation
|
+11% / +18% / +3% at constant currency
|
Strong products coexist with uneven breadth of growth.
|
|
Transaction Processing / IBM Z
|
−9% constant currency / −42% reported
|
ELA timing and the equipment cycle can overpower subscription momentum.
|
|
FY2026 revenue / FCF outlook
|
+4–5% constant currency; FCF up about USD 1 billion
|
An implied roughly USD 15.7 billion FCF remains a management expectation.
|
|
October catalysts
|
Bob self-hosting October 1; Leena AI investment October 20
|
Product reach and ecosystem activity provide opportunity; no quantified incremental earnings bridge is disclosed.
|
The main distinction for the upcoming result is between delayed monetization and permanently weaker demand. Management attributed much of the Q2 shortfall to large transactions that failed to close on schedule as customers prioritized constrained infrastructure purchases. That explanation is plausible but is still management's explanation. Evidence of recovery should appear in organic software revenue, transaction closures and cash collection, rather than only in pipeline commentary.
Recurring revenue also needs careful interpretation. IBM's ARR is derived by annualizing the current quarter's recurring software revenue. It is not contracted backlog, and it does not independently measure net customer retention. Confluent contributes to the enlarged base. The right question is whether subscription growth remains healthy after accounting for acquisitions and whether new product sales expand customer spending without disproportionate discounts.
The October 1 self-hosted option for IBM Bob broadens access to customers that need control over code and deployment. The October 20 IBM Ventures investment in Leena AI adds exposure to back-office agents. Neither announcement supplies a sufficient audited revenue-and-margin bridge for a separate earnings uplift. The correct base treatment is potential future attachment to IBM's software and consulting relationships, with costs and execution requirements recognized alongside that opportunity.
3. Fundamental Quality
Quality assessment: strong installed-base economics, mixed current growth, stable underlying cash generation and a leveraged capital-allocation profile. IBM's ability to fund investment and distributions is established, but the latest results do not yet show the organic acceleration needed for an aggressive rerating.
|
Metric
|
H1 2025
|
H1 2026
|
Change / definition
|
|
Revenue, USD billion
|
31.519
|
33.079
|
+4.9%
|
|
GAAP gross margin
|
57.1%
|
57.0%
|
−0.1 percentage point
|
|
GAAP pre-tax margin
|
11.9%
|
11.7%
|
−0.2 percentage point
|
|
GAAP diluted continuing EPS, USD
|
3.43
|
3.55
|
+3.5%
|
|
GAAP operating cash flow, USD billion
|
6.071
|
7.766
|
+27.9%
|
|
Financing-receivable cash contribution, USD billion
|
0.606
|
2.264
|
Excluded from IBM FCF
|
|
OCF excluding financing receivables, USD billion
|
5.465
|
5.503
|
+0.7%
|
|
Net capital expenditure, USD billion
|
0.657
|
0.743
|
+13.1%
|
|
IBM-defined FCF, USD billion
|
4.808
|
4.760
|
−1.0%
|
|
FCF / revenue
|
15.3%
|
14.4%
|
Calculated from unrounded values
|
Amounts follow the July release and SEC filing; ratios are calculated. Net capital expenditure includes property, plant and equipment, capitalized software and related disposal proceeds. The table uses comparable six-month periods; rounded margins can differ slightly from changes calculated using underlying values.
The cash bridge is particularly important: USD 7.766 billion GAAP OCF − USD 2.264 billion financing-receivable contribution − USD 0.743 billion net capital expenditure = USD 4.759 billion, versus disclosed FCF of USD 4.760 billion because of rounding. A simple OCF-minus-equipment-spending measure would produce a materially different answer. IBM's definition better isolates non-financing cash generation, but FCF remains a non-GAAP measure and excludes acquisition spending.
Management maintained an expectation of about USD 1 billion more FCF than in 2025. Using the rounded USD 14.7 billion annual baseline implies approximately USD 15.7 billion for 2026. Deducting H1 FCF of USD 4.760 billion leaves USD 10.94 billion for H2, or 69.7% of the implied full-year amount. IBM's year-end weighting makes that possible, but it means that the full-year yield should not be treated as already earned. A Q3 improvement with a growing Q4 dependency would be weaker evidence than broader collection progress.
Profitability improved unevenly. Consulting's segment margin increased despite little revenue growth, showing that productivity can support earnings in a slow market. Software's gross margin declined while its segment margin rose, indicating that operating discipline helped offset product and investment pressures. This combination is useful but has limits: repeated cost reductions cannot indefinitely substitute for revenue growth without weakening product development, sales capacity or service delivery.
The balance sheet is a constraint rather than a crisis. June cash, restricted cash and marketable securities were about USD 8.2 billion against USD 62.0 billion total debt. Of that debt, USD 13.0 billion was associated with Financing; the presentation reports USD 48.9 billion core debt. Core debt increased from USD 46.2 billion at year-end. Financing debt has associated assets, so subtracting all debt from a software-only valuation without matching financing assets would distort the comparison. Conversely, excluding financing debt does not make the remaining leverage disappear.
Capital allocation must be assessed after acquisitions. H1 acquisition spending exceeded H1 company-defined FCF, while dividends used another USD 3.2 billion. Acquisitions can create durable strategic value, but they are cash uses and introduce integration, amortization and execution costs. The FCF multiple used here is an equity cash-flow convention for IBM's disclosed measure, not an enterprise-value multiple or a claim that all FCF can immediately be distributed.
The single most important variable is organic software revenue converting into financing-adjusted cash flow. Improving organic demand would validate both the customer proposition and the economics of the enlarged portfolio. An increase in reported revenue driven primarily by acquisitions would provide much less evidence. The base case assumes gradual improvement while maintaining investment, rather than a sudden return to premium growth.
4. Industry and Competitive Landscape
IBM operates across enterprise software, hybrid infrastructure and technology services. These markets share customers but have different economics. Cloud consumption captures usage growth, application suites monetize business processes, middleware manages complexity and consulting monetizes implementation effort. AI can increase demand at each layer while shifting spending toward the layer that delivers the clearest immediate benefit.
|
Competitive layer
|
IBM scale / evidence
|
Alternatives
|
Valuation implication
|
|
Hybrid application runtime
|
Red Hat grew 11% at constant currency
|
Microsoft and cloud-native alternatives
|
IBM benefits when customers retain deployment flexibility; public-cloud consumption grows faster.
|
|
Enterprise data and control
|
Data grew 18% at constant currency
|
SAP and cloud data platforms
|
Acquired data assets strengthen reach; integration and attachment determine economic returns.
|
|
AI implementation and operations
|
Consulting grew 1% at constant currency
|
Accenture and specialist firms
|
IBM has installed-base access, but recent peer growth is stronger.
|
|
Mission-critical computing
|
Infrastructure revenue USD 3.835 billion
|
Cloud migration and alternative infrastructure
|
Large switching costs support retention; purchase timing still creates earnings volatility.
|
|
Sovereign AI and quantum
|
Self-hosted Bob; Anderon award up to USD 1 billion
|
Hyperscalers and specialist platforms
|
Deployment choice expands opportunity; grants and venture investments do not establish recurring profit.
|
This framework uses disclosed operating scale rather than an unsupported market-share estimate. The comparison does not claim that a percentage point of cloud growth equals a percentage point of mainframe software growth. IBM can benefit from a growing enterprise AI budget and still lose relative wallet share if other providers monetize adoption faster.
|
Company
|
Reporting period
|
Revenue / scale
|
Growth
|
Profitability measure
|
Relevant KPI
|
|
IBM
|
Q2 2026, June 30
|
USD 17.162 billion
|
+1% reported
|
19.2% operating non-GAAP pre-tax margin
|
Software ARR USD 24.6 billion; Consulting +1% constant currency
|
|
Microsoft
|
FY2026 Q4, June 30
|
USD 90.0 billion
|
+18% reported
|
45.1% GAAP operating margin, calculated
|
Azure and other cloud services +43%; Intelligent Cloud USD 39.3 billion
|
|
SAP SE
|
Q2 2026, June 30
|
Total revenue +9%; currency retained
|
Cloud +22% reported / +24% constant currency
|
IFRS operating profit +8%; margin not used
|
Current cloud backlog EUR 22.9 billion, +26% constant currency
|
|
Accenture plc
|
FY2026 Q4, August 31
|
USD 18.7 billion
|
+6% reported / +7% local currency
|
15.3% GAAP operating margin
|
Bookings USD 22.2 billion; quarterly FCF USD 2.8 billion
|
Periods and definitions are approximate comparisons. Microsoft and IBM cover the June quarter; Accenture covers August. Microsoft margin is USD 40.6 billion operating income divided by USD 90.0 billion revenue. IBM's non-GAAP pre-tax margin includes a different adjustment set and financing effects. SAP reports under IFRS in EUR; growth and backlog are retained in original units. These data support business comparisons, not a mechanically ranked margin league table.
Microsoft is the clearest winner in current cloud monetization: its Azure growth indicates a much faster expansion in infrastructure consumption than IBM's overall revenue. SAP is winning in enterprise cloud migration and backlog growth. Accenture's latest revenue growth is stronger than IBM Consulting's, suggesting that the implementation opportunity is available but that IBM's recent execution has lagged this benchmark. These observations do not prove share movements in identical markets, because the firms' business mixes differ.
Within IBM, Red Hat and Data are the current growth winners, while Transaction Processing and IBM Z were the Q2 revenue losers. Calling the latter structurally obsolete would go beyond the evidence; calling their decline irrelevant would also be wrong. They remain economically important and can influence customer spending on the rest of the portfolio. A recovery in large transactions would therefore have disproportionate significance for the overall growth debate.
IBM is a net strategic beneficiary of hybrid AI complexity, because governance, deployment choice and integration fit its capabilities. It is currently a weaker beneficiary in realized growth than the fastest-growing cloud and application peers. Its strongest route to improved economics is selling more software into an existing relationship while preserving customer control across environments. Its principal competitive risk is that an application vendor or cloud platform bundles enough orchestration and governance to reduce the need for another paid layer.
Quantum deserves separate discipline. The Commerce Department's finalized award of up to USD 1 billion to Anderon supports manufacturing development; it does not establish near-term commercial demand, profit or grant cash receipt in the current quarter. Research optionality may become valuable, but this report assigns no separate quantum premium. The cash-flow case must stand on the existing enterprise franchise.
5. Key Risks
-
Delayed licenses become lost business. If organic software growth stays flat or negative and Transaction Processing remains deeply negative, the explanation of timing becomes less persuasive. Lower revenue absorption would constrain profit and undermine the FCF multiple.
-
Cash recovery remains financing-led. If GAAP OCF grows while cash generation excluding financing receivables stagnates, headline liquidity improvement would not validate the operating thesis. A full-year FCF cut would directly reduce the valuation denominator.
-
Acquisition integration weakens returns. If cross-selling disappoints or retention and integration spending rise, purchased growth could consume more cash than expected. Higher core debt would then restrict dividends, investment flexibility and future acquisitions.
-
AI budgets bypass IBM's paid software layers. If customers consolidate governance, development and agents within existing application or cloud contracts, adoption could grow without comparable IBM revenue. Pricing pressure would reduce incremental margins in the operating bridge.
-
Productivity actions damage delivery capacity. If expense reductions impair specialist sales coverage or consulting execution, near-term margin gains could be followed by weaker bookings and renewals. That would lower the durability of the assumed cash conversion.
-
The infrastructure cycle extends the downturn. Additional deferrals in IBM Z and associated enterprise agreements would weigh on hardware and software simultaneously. Quarterly mix deterioration could offset recurring subscription growth.
-
Capital-intensive optionality expands before monetization. Quantum investment or new commitments that outpace cash returns could increase capital needs. Government support reduces some funding burden but does not eliminate execution or commercialization risk.
6. Monitoring Checklist
The following are research thresholds, not company guidance or verified market consensus. They are designed to make the thesis falsifiable at the Q3 release and subsequent updates.
-
Organic software growth: above 3% would strengthen the recovery case; flat or negative would weaken it. Separate acquisition contribution from comparable growth.
-
Recurring demand: sustained double-digit Red Hat growth and ARR growth above the latest 8% would be constructive, provided the acquisition bridge is disclosed. A larger reported base with weaker underlying demand would not qualify.
-
Transaction recovery: a move in constant-currency Transaction Processing growth toward zero would support the delayed-deal explanation; another decline near 9% would increase structural concern.
-
Cash progress: retain the approximately USD 15.7 billion implied annual FCF objective and inspect the remaining Q4 requirement. A cut below USD 15 billion would weaken the valuation cushion even if adjusted EPS holds up.
-
Consulting growth and margin: revenue growth above 3% at constant currency with segment margin at least 12% would indicate a healthier growth-profit mix; margin gains with shrinking revenue provide weaker confirmation.
-
Core debt: a decline from June's USD 48.9 billion would support capital discipline. A rise without a transparent acquisition or investment return case would weaken it.
-
AI monetization and investment disclosure: look for identifiable paid production deployments, renewals, incremental software revenue and associated costs for Bob and orchestration products. Announcements and venture stakes alone do not change the earnings model.
Material information boundary: no Q3 financial results, independently verified live earnings consensus or options-implied move are included. The closest public financials are Q2/H1 2026. All valuation scenarios and operational thresholds are this report's assumptions. The upcoming release can materially change the conclusion. LBank's populated official trading HTML was checked by command-line HTTP on October 21; it establishes the observed token market interface, not executable depth or direct legal ownership of IBM shares.
7. Sources
-
IBMON/USDT Spot Trading | LBank (https://www.lbank.com/trade/ibmon_usdt) — 2026-10-21; populated trading interface archived; token quote is not the NYSE stock quote.
-
-
-
-
IBM RELEASES SECOND-QUARTER RESULTS (https://newsroom.ibm.com/2026-07-22-IBM-RELEASES-SECOND-QUARTER-RESULTS) — 2026-07-22; quarter and six months ended 2026-06-30; GAAP and reconciled non-GAAP data.
-
-
IBM 2Q26 Earnings Prepared Remarks (https://www.ibm.com/downloads/documents/us-en/16ddab5a95547e81) — 2026-07-22; organic growth, ARR and management explanation of delayed deals.
-
IBM 2Q 2026 Earnings (https://www.ibm.com/downloads/documents/us-en/16ddab5a95547e82) — 2026-07-22; cash-flow reconciliation and core debt.
-
IBM 2025 Annual Report (https://www.ibm.com/downloads/documents/us-en/15db52348fc203a4) — Year ended 2025-12-31; annual FCF baseline and accounting context.
-
-
-
-
-
-
-



 Transfer