Author: LBank Research Analyst: Ludo
Coverage Type: Thematic report. The verified LBank instruments are futures, not spot pairs; Laopu Gold is included as a user-specified listed-equity comparator.
Disclaimer: This report is compiled and analyzed from publicly available information and is intended solely for information sharing and research discussion. It does not constitute investment advice, a securities recommendation, a trading instruction, or any guarantee of returns. The company operations, valuations, market prices, and consensus expectations discussed herein may change over time. Readers should independently verify the data and make their own decisions.
1. Core Conclusion
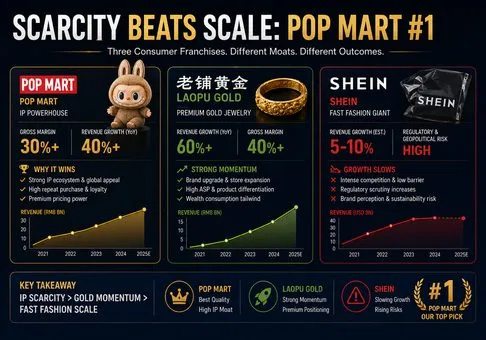
Overall judgment: the strongest Chinese consumer franchises are shifting from low-price scale toward manufactured scarcity, emotional identity, and cultural pricing power. Pop Mart offers the best risk-adjusted operating quality, Laopu Gold has the strongest near-term earnings momentum but the highest working-capital risk, and SHEIN has the broadest global platform but the weakest incremental margin visibility.
-
Scarcity currently beats scale. SHEIN generated USD 41.85 billion of 2025 revenue, far more than the other two companies, but its revenue growth slowed to 8.0% and Q1 2026 operating margin fell to 2.9%. Pop Mart and Laopu Gold are smaller but convert brand scarcity into much higher margins: Pop Mart produced a 30.0% adjusted net margin in H1 2026, while Laopu reached 21.8%. Consumer attention is therefore most valuable when the company controls supply, story, and distribution rather than merely reducing price and delivery time.
-
Pop Mart ranks first because its multi-IP engine is becoming more important than any single character.H1 2026 revenue rose 23.8% to RMB 17.17 billion even though THE MONSTERS revenue declined 7.5%. The roughly RMB 2.26 billion increase from Twinkle Twinkle more than offset the approximately RMB 0.36 billion decline in THE MONSTERS; their net contribution explains about 58% of total group revenue growth. This is evidence of portfolio renewal. The concern is geographic: Americas revenue fell 16.5%, APAC fell 9.7%, and inventory days stretched to 201 from 123.
-
Laopu Gold ranks second and has the best earnings momentum, but its headline growth contains timing and inventory effects. H1 2026 revenue rose 60.3%, adjusted net profit rose 83.6%, and gross margin expanded 3.2 percentage points. The online channel grew 171.9%, while boutique revenue rose 43.5%. Yet inventory reached RMB 19.02 billion, inventory days increased to 271, and bank borrowings reached RMB 6.76 billion. Premium gold jewelry has real cultural pricing power, but investors should separate recurring brand demand from gold-price pass-through, pre-price-increase purchases, and inventory gains.
-
SHEIN ranks third despite its unmatched customer scale and liquidity. It served 273 million active customers in 2025, generated USD 2.84 billion of operating cash flow, and held about USD 14.79 billion of cash, restricted cash, and deposits. However, Q1 2026 revenue grew only 1.1%, US revenue fell 14.3%, and fulfillment plus marketing expense ratios increased by 8.6 percentage points in aggregate. The removal of the US de minimis exemption demonstrates that SHEIN's economics remain unusually exposed to customs policy and cross-border fulfillment costs.
-
Valuation favors Laopu and SHEIN, while quality favors Pop Mart. At fixed September 1-2 market references, SHEIN's IPO valuation was roughly 12.8 times 2025 net income, Laopu traded near 8.6 times trailing earnings, and Pop Mart near 13.3 times. These figures are not perfectly comparable because periods and currencies differ, but they show that the market is already discounting sustainability risk at Laopu and regulatory risk at SHEIN. Pop Mart deserves a quality premium only if overseas growth resumes and inventory normalizes.
The thematic preference is Pop Mart first, Laopu Gold second, SHEIN third. A more constructive view on SHEIN requires renewed double-digit revenue growth with a Q1 operating margin above 4%. Laopu moves to first if inventory days fall below 230 while adjusted profit continues to grow above 30%. Pop Mart loses first place if overseas revenue remains negative for two consecutive halves or inventory days stay above 200 without matching sell-through growth.
2. Company Overview, Business Mix, and Core Operating Metrics
The three companies sell very different products, but their business models sit on one continuum. SHEIN optimizes a global digital supply network for speed and breadth. Pop Mart packages artist-created characters into collectible products, stores, vending formats, and experiences. Laopu Gold combines precious-metal value with heritage craftsmanship and luxury retail. The common variable is control over the consumer proposition: the stronger the control over design, distribution, and perceived scarcity, the less the business depends on price competition.
|
Company
|
Core proposition
|
Latest scale
|
Growth engine
|
Primary constraint
|
|
SHEIN
|
On-demand global fashion marketplace with broad assortment and low prices
|
2025 revenue USD 41.85 billion; 273 million active customers
|
Supplier digitization, rapid testing, marketplace services, and geographic reach
|
Customs rules, fulfillment cost, labor scrutiny, and slowing US demand
|
|
Pop Mart
|
Character IP transformed into collectibles, retail experiences, and licensed content
|
H1 2026 revenue RMB 17.17 billion; 631 stores globally
|
New IP incubation, product cadence, direct retail, and overseas localization
|
IP fashion cycles, overseas normalization, and inventory accumulation
|
|
Laopu Gold
|
Heritage-inspired handcrafted gold jewelry positioned as cultural luxury
|
H1 2026 revenue RMB 19.81 billion; 45 boutiques
|
Premium product innovation, top-mall expansion, online reach, and price increases
|
Gold-price exposure, working capital, store concentration, and demand timing
|
SHEIN's 2025 product revenue was USD 37.11 billion, or 88.7% of group revenue, while service revenue was USD 4.74 billion. Europe contributed 35.4% of revenue, the US 24.1%, and other regions 40.5%. That diversity is useful, but Q1 2026 exposed the limits of geographic offset: US revenue declined by roughly USD 340 million year over year, while total group revenue increased by only USD 99 million to USD 9.05 billion.
Pop Mart's proprietary products represented 99.3% of H1 2026 revenue and artist IPs represented 89.0%. THE MONSTERS remained the largest franchise at RMB 4.45 billion, followed by Twinkle Twinkle at RMB 2.65 billion, CRYBABY at RMB 1.63 billion, DIMOO at RMB 1.62 billion, SKULLPANDA at RMB 1.55 billion, HIRONO at RMB 1.01 billion, and MOLLY at RMB 0.90 billion. This breadth reduces dependence on one hit, although THE MONSTERS still represented 26.0% of revenue.
Laopu's boutique channel generated RMB 15.41 billion, or 77.8% of H1 revenue, while online revenue reached RMB 4.40 billion, or 22.2%. Overseas revenue grew 107.8% to RMB 3.32 billion and represented 16.7% of the total. The company remains physically concentrated, with 45 self-operated boutiques located in 35 high-end shopping malls across 16 cities, but digital sales provide a meaningful second channel.
|
Operating metric
|
SHEIN
|
Pop Mart
|
Laopu Gold
|
Investment interpretation
|
|
Latest revenue growth
|
Q1 2026: 1.1%
|
H1 2026: 23.8%
|
H1 2026: 60.3%
|
Brand scarcity is producing faster growth than fashion scale
|
|
Key mix shift
|
US revenue down 14.3%
|
PRC up 47.3%; overseas down about 11%
|
Online up 171.9%
|
Each company has one powerful channel and one material concentration risk
|
|
Customer or network scale
|
281 million trailing active customers at March 2026
|
455 Greater China stores; 176 overseas stores
|
45 boutiques in 35 malls
|
SHEIN wins reach; Pop Mart wins retail optionality; Laopu wins selectivity
|
|
Portfolio concentration
|
Products 88.7% of 2025 revenue
|
THE MONSTERS 26.0% of H1 revenue
|
Boutiques 77.8% of H1 revenue
|
Concentration differs by product, IP, and channel, but none is fully diversified
|
The operating evidence supports a clear distinction. SHEIN is an efficiency platform whose growth is constrained by external rules. Pop Mart is an IP portfolio whose growth depends on repeated creative renewal. Laopu is a luxury retailer whose growth depends on price acceptance, craftsmanship, and access to premium locations. The latter two currently control more of the value chain that determines willingness to pay.
3. Fundamental Quality
|
Item
|
SHEIN
|
Pop Mart
|
Laopu Gold
|
Quality judgment
|
|
Latest period
|
FY 2025 and Q1 2026
|
H1 2026
|
H1 2026
|
Periods differ; direction is more useful than absolute comparison
|
|
Gross margin
|
67.9% in 2025
|
69.7%
|
41.3%
|
SHEIN's reported gross margin precedes unusually high fulfillment expense
|
|
Operating or adjusted net margin
|
Operating 4.1% in 2025; 2.9% in Q1 2026
|
Adjusted net 30.0%
|
Adjusted net 21.8%
|
Pop Mart has the cleanest margin structure
|
|
Operating cash flow
|
USD 2.84 billion in 2025; USD 0.39 billion in Q1 2026
|
RMB 3.64 billion
|
RMB 2.01 billion
|
All are cash generative, but cash conversion weakened at SHEIN and Laopu
|
|
Approximate free cash flow
|
USD 2.62 billion in 2025
|
RMB 2.91 billion
|
RMB 1.94 billion
|
Calculated as operating cash flow less disclosed capital expenditure
|
|
Liquidity and debt
|
USD 14.79 billion aggregate cash and deposits
|
RMB 12.44 billion cash; no bank borrowings
|
RMB 2.76 billion cash; RMB 6.76 billion bank borrowings
|
Pop Mart has the strongest balance-sheet quality
|
|
Inventory signal
|
Marketplace model limits direct comparability
|
Days 201 versus 123
|
Days 271 versus 216
|
Inventory is the central risk for both scarcity models
|
SHEIN: strong liquidity, weak incremental economics. The company produced USD 2.06 billion of 2025 net income and USD 2.84 billion of operating cash flow. Capital expenditure on property and equipment was only USD 222 million, supporting an approximate USD 2.62 billion of free cash flow. However, Q1 2026 operating cash flow fell to USD 392 million from USD 1.06 billion a year earlier. Fulfillment expense represented 51.2% of revenue and marketing 18.4%, up about 5.0 and 3.6 percentage points, respectively. This more than explains why a high reported gross margin did not translate into high operating profitability.
Pop Mart: high margin, net cash, but deteriorating working capital. H1 operating profit was RMB 6.72 billion and adjusted net profit RMB 5.16 billion. Approximate free cash flow of RMB 2.91 billion equaled 56.5% of adjusted profit. That is solid but not exceptional for a business with negative working-capital potential, and the increase in inventory days is the reason. Cash of RMB 12.44 billion and no bank borrowings give management ample capacity to absorb normalization, invest in stores, or repurchase shares. Financial quality is the strongest in the group.
Laopu Gold: superior earnings growth with balance-sheet intensity. Gross profit grew 73.7%, faster than revenue, and the 3.2-point gross-margin expansion added approximately RMB 634 million of gross profit relative to a constant-margin scenario. Operating leverage then lifted adjusted profit by 83.6%. Yet approximate free cash flow of RMB 1.94 billion was only 44.9% of adjusted profit. Inventory increased by almost RMB 2.97 billion from year-end and exceeded H1 revenue, while bank borrowings exceeded cash. Some inventory can appreciate with gold, but financing and liquidity risk rise when inventory growth outruns sell-through.
Reported valuation reinforces rather than resolves the quality debate. SHEIN's roughly USD 26.5 billion IPO valuation equals about 12.8 times 2025 net income and only 0.6 times revenue. Pop Mart's September 2 market capitalization was approximately HKD 203.5 billion, with a displayed trailing P/E near 13.3 times. Laopu's September 1 market capitalization was around HKD 70.3 billion, with a displayed trailing P/E near 8.6 times. The lower multiples on SHEIN and Laopu compensate for identifiable regulatory and cash-conversion risks; they are not automatic mispricing.
4. Industry and Competitive Landscape
The relevant consumer landscape is not defined by product category alone. The companies compete for discretionary wallet share through three economic models: algorithmic abundance, collectible identity, and cultural luxury. Zara and other fast-fashion brands challenge SHEIN on design speed and physical presence. MINISO and Sanrio challenge Pop Mart on affordable IP merchandise and global retail. Chow Tai Fook and other jewelers challenge Laopu on trust, gold procurement, and store networks.
|
Value-chain dimension
|
SHEIN
|
Pop Mart
|
Laopu Gold
|
Who has the advantage
|
|
Demand discovery
|
Real-time digital testing across a very broad catalog
|
Fan communities, launches, and character engagement
|
VIP demand, cultural motifs, and mall-based clienteling
|
SHEIN on data speed; Pop Mart on emotional depth
|
|
Supply control
|
Digitized third-party supplier network
|
Own IP portfolio with outsourced manufacturing
|
Design, craftsmanship standards, gold procurement, and direct retail
|
Laopu on scarcity; SHEIN on flexibility
|
|
Pricing power
|
Low; proposition centers on affordability
|
High when IP demand exceeds controlled releases
|
High when gold value and cultural status reinforce each other
|
Laopu, then Pop Mart
|
|
Global portability
|
Proven across roughly 160 markets
|
Promising but H1 overseas revenue declined
|
Early stage; overseas was 16.7% of revenue
|
SHEIN by a wide margin
|
|
Capital requirement
|
High fulfillment and marketing expense
|
Growing inventory and store investment
|
Very high gold inventory and premium store deposits
|
Pop Mart has the best balance
|
|
Company
|
Latest comparable period
|
Revenue growth
|
Margin indicator
|
Competitive read-through
|
|
SHEIN
|
FY 2025
|
8.0%
|
Operating margin 4.1%
|
Largest scale, but policy-sensitive unit economics
|
|
Inditex
|
FY 2025
|
3.2% reported; 7.0% constant currency
|
Gross margin 58.3%
|
Physical stores and premium execution support resilience
|
|
Pop Mart
|
H1 2026
|
23.8%
|
Adjusted net margin 30.0%
|
Superior profitability, with overseas and inventory caveats
|
|
MINISO Group
|
H1 2026
|
22.4%
|
Gross margin 44.3%
|
Broader value retail and TOP TOY provide a lower-margin IP alternative
|
|
Laopu Gold
|
H1 2026
|
60.3%
|
Adjusted net margin 21.8%
|
Strongest growth and premiumization, highest working-capital intensity
|
|
Chow Tai Fook
|
FY 2026
|
5.3%
|
Gross margin 32.3%
|
Scale and trust are formidable, but growth is slower and positioning broader
|
Periods, accounting bases, and currencies differ, so the table is directional rather than a strict valuation screen. It nonetheless shows the strategic trade-off. Inditex grows more slowly than SHEIN but benefits from established physical retail and less dependence on small-parcel exemptions. MINISO matches Pop Mart's growth rate but has materially lower gross margin because general merchandise and licensed products capture less scarcity value. Chow Tai Fook is much larger and more diversified than Laopu, yet its slower growth and lower gross margin illustrate how Laopu's narrow cultural-luxury positioning currently creates greater pricing power.
The central transmission mechanism is from narrative control to financial return. A differentiated design creates attention; controlled distribution turns attention into scarcity; scarcity supports price and gross margin; direct channels preserve customer data and retail profit; but excess inventory reveals when perceived scarcity has been overproduced. Pop Mart currently manages this chain best. Laopu captures the highest growth but finances a heavy inventory base. SHEIN excels at demand detection and supply response, but logistics and customer acquisition absorb much of the gross profit.
5. Key Risks
-
SHEIN customs and regulatory risk. The US removal of the de minimis exemption has already coincided with a 14.3% Q1 decline in US revenue and higher fulfillment expense. Elimination of the European Union's low-value parcel exemption would affect a region that produced 35.4% of 2025 revenue. Higher duties, inspections, or product-liability obligations would transmit directly through price, conversion, delivery time, and margin.
-
SHEIN labor, product, and listing risk. Allegations involving supplier labor standards, intellectual-property infringement, product safety, or data practices could restrict market access and raise compliance costs. The Hong Kong listing improves disclosure but does not eliminate global political scrutiny. A delayed expansion plan or restrictions in a major market would challenge the low valuation thesis.
-
Pop Mart IP-cycle risk. Collectible demand can reverse quickly when a character becomes overexposed. THE MONSTERS already declined 7.5% in H1 2026. If Twinkle Twinkle and newer IPs fail to compensate, store productivity and inventory turns would weaken simultaneously. An IP concentration above 30% combined with group growth below 15% would be an adverse signal.
-
Pop Mart overseas execution risk. Americas revenue declined 16.5% and APAC declined 9.7%, even as the store base expanded. Management cited normalized IP popularity and weak online acquisition in the Americas. Another half of negative overseas revenue would suggest that global fan attention is less durable than the domestic brand engine.
-
Laopu inventory, gold-price, and financing risk. Inventory days reached 271 and bank borrowings exceeded cash by about RMB 4.00 billion. A gold-price decline can reduce traffic or create inventory valuation pressure; a sharp increase can require more financing and make products less affordable. Either direction can weaken cash conversion.
-
Laopu demand-timing risk. Price adjustments and expectations of higher gold prices can pull purchases forward. If quarterly revenue following a price increase falls sharply, half-year growth may overstate the sustainable run rate. Same-store demand, online repeat behavior, and inventory turnover are more important than the number of new boutiques.
-
Valuation and instrument risk. Market prices and displayed multiples are fixed-date references and can change rapidly. The LBank products for SHEIN and Pop Mart are leveraged perpetual futures, not ownership of the underlying equities. Funding rates, liquidation mechanics, trading hours, index construction, and basis risk can cause returns to diverge materially from the shares.
-
Macro and discretionary-spending risk. Fashion, collectibles, and premium jewelry all depend on consumer confidence, but their sensitivities differ. SHEIN may benefit from trade-down while suffering higher logistics cost; Pop Mart may lose discretionary frequency; Laopu may experience both safe-haven gold demand and affordability pressure. A broad slowdown does not create equal outcomes.
6. Monitoring Checklist
-
SHEIN growth and margin: quarterly revenue growth above 10% and operating margin above 4% would indicate stabilization. Growth below 5% with operating margin below 3% would confirm that policy and acquisition costs are overwhelming scale benefits.
-
SHEIN regional mix: watch US revenue for a return to growth and Europe for evidence of preparation for customs changes. A second double-digit US decline without faster other-region growth is negative.
-
Pop Mart IP renewal: track revenue from Twinkle Twinkle, CRYBABY, DIMOO, SKULLPANDA, HIRONO, and MOLLY against THE MONSTERS. Newer IP growth should continue to exceed declines in mature franchises.
-
Pop Mart overseas revenue: a return to positive growth in both Americas and APAC would validate global portability. Another half with overseas revenue down more than 5% would weaken the premium thesis.
-
Pop Mart inventory: inventory days below 170 would signal improving sell-through; a level above 200 with revenue growth below 20% would indicate overproduction or channel loading.
-
Laopu cash conversion: operating cash flow should exceed 60% of adjusted profit over a rolling year. A ratio below 45% while borrowings rise would imply that accounting growth is consuming balance-sheet capacity.
-
Laopu inventory and price: inventory days below 230 would support the luxury thesis. Days above 280, especially with slower online growth, would indicate that scarcity is becoming stock accumulation.
-
Relative valuation: compare price-to-earnings and free-cash-flow yield only after aligning periods and adjusting for net cash or debt. Pop Mart warrants the highest multiple while its balance sheet is strongest; Laopu and SHEIN require larger discounts until their specific risks improve.
-
LBank product status: verify contract specifications, funding frequency, leverage, and index methodology before trading. Laopu Gold remains outside verified LBank coverage as of the report date.
7. Sources