Author: LBank Research Analyst: Ludo
Disclaimer: This report is compiled and analyzed from publicly available information and is intended solely for information sharing and research discussion. It does not constitute investment advice, a securities recommendation, a trading instruction, or any guarantee of returns. The company operations, valuations, market prices, and consensus expectations discussed herein may change over time. Readers should independently verify the data and make their own decisions.
1. Core Conclusion
Overall judgment: Broadcom is an exceptional infrastructure company whose AI semiconductor ramp and VMware cash engine now reinforce each other, but the equity remains priced for near-flawless execution; the risk-reward bias is therefore modestly negative at roughly 45 times trailing free cash flow, with custom AI accelerator revenue conversion as the decisive variable.
-
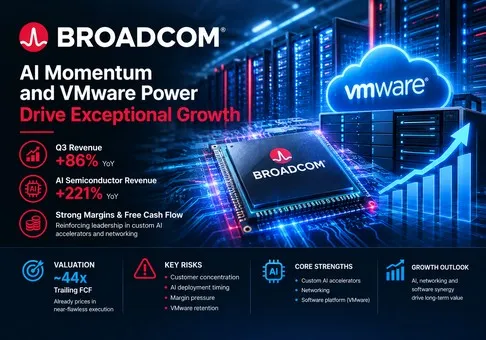
The operating result was outstanding, but expectations are already extraordinary. Fiscal third-quarter 2026 revenue rose 86% year over year to USD 29.6 billion, GAAP operating income increased 171% to USD 16.0 billion, and free cash flow nearly doubled to USD 13.7 billion. Yet the shares fell 2.7% on September 3 after management guided fiscal Q4 revenue to approximately USD 34.8 billion, slightly below the secondary consensus cited by market reports. The investment implication is clear: beating reported numbers is no longer enough; Broadcom must keep raising the forward AI revenue slope.
-
AI semiconductors have become the company, not merely a growth option. Q3 AI semiconductor revenue reached USD 16.7 billion, up 221% year over year and 54% sequentially, representing about 56% of consolidated revenue and 80% of semiconductor segment revenue. Management expects USD 21.7 billion in Q4, which would lift the AI mix to roughly 62% of guided group revenue. This concentration creates powerful earnings leverage, but it also makes customer deployment timing and design-win durability the primary valuation risks.
-
VMware is doing its job as the margin and cash-flow ballast. Infrastructure software revenue grew 29% to USD 8.8 billion while semiconductor solutions grew 127% to USD 20.8 billion. Despite the much heavier semiconductor mix, non-GAAP operating margin remained approximately 68% in Q3 and is guided to about 66% in Q4. Software therefore protects group economics while custom accelerators and networking drive growth; a material slowdown in VMware Cloud Foundation renewals would remove that buffer.
-
Cash conversion is excellent, but the stock still discounts several years of successful scaling. Q3 free cash flow equaled 46% of revenue, and nine-month free cash flow was USD 31.9 billion. At the September 8 close of USD 368.66 and an estimated equity value near USD 1.75 trillion, trailing free cash flow is approximately USD 39.4 billion, implying a free-cash-flow yield near 2.3%, or about 44 times trailing free cash flow. That is defensible only if the AI revenue ramp remains steep and margins stay structurally high.
-
The thesis is falsifiable at specific operating thresholds. The constructive business view strengthens if Q4 AI semiconductor revenue reaches at least USD 21.7 billion, consolidated revenue reaches roughly USD 34.8 billion, and non-GAAP operating margin holds near 66%. It weakens if AI revenue misses the company target by more than 5%, group free-cash-flow margin falls below 40%, or infrastructure software growth drops below 15%. The equity view would become more attractive through either materially higher cash earnings or a lower valuation, not through narrative expansion alone.
The central transmission chain is directly calculable. Moving AI semiconductor revenue from USD 16.7 billion in Q3 to the guided USD 21.7 billion in Q4 adds USD 5.0 billion sequentially. Holding non-AI revenue at the Q3 level would produce about USD 34.6 billion of group revenue, close to the USD 34.8 billion guide. Applying the 66% guided non-GAAP operating margin yields approximately USD 23.0 billion of quarterly operating income. The operational ramp is therefore large enough to justify earnings growth, but the current valuation requires this bridge to repeat beyond one quarter.
2. Company Overview, Business Mix, and Core Operating Metrics
Broadcom designs semiconductors and infrastructure software for mission-critical computing and communications. Its semiconductor portfolio spans custom AI accelerators, Ethernet switching and routing silicon, network interface cards, optical and physical-layer components, broadband access, wireless connectivity, storage connectivity, and industrial applications. The company generally sells high-complexity devices and intellectual property into long product cycles, often co-developing custom silicon with a small number of hyperscale customers.
Infrastructure software combines VMware Cloud Foundation with mainframe, cybersecurity, enterprise automation, and Fibre Channel storage-area-network products. Customers pay through subscriptions, term licenses, maintenance, and support arrangements. This software base is less cyclical than semiconductor shipments and has become Broadcom's principal source of recurring economics, renewal leverage, and margin stability.
|
Q3 FY2026 business
|
Products and customers
|
Revenue
|
Year-over-year
|
Revenue mix
|
Research judgment
|
|
Semiconductor solutions
|
Custom AI accelerators, Ethernet and optical networking, connectivity, storage, broadband, wireless, and industrial silicon sold to hyperscalers and equipment makers
|
USD 20.84 billion
|
127%
|
70%
|
The growth engine; increasingly dominated by AI customer programs
|
|
Infrastructure software
|
VMware private cloud, mainframe, security, enterprise software, and Fibre Channel networking for large organizations
|
USD 8.75 billion
|
29%
|
30%
|
Recurring margin ballast, but customer retention must justify the post-acquisition pricing model
|
|
Total
|
Integrated semiconductor and infrastructure-software platform
|
USD 29.59 billion
|
86%
|
100%
|
A high-growth AI platform with unusually strong cash conversion
|
The mix shift is dramatic. Semiconductor solutions were 57% of revenue one year earlier and 70% in Q3 FY2026. Within that segment, AI semiconductor revenue of USD 16.7 billion represented roughly four-fifths of segment revenue. Broadcom is thus less diversified at the margin than the two-segment presentation suggests. VMware and legacy semiconductor franchises remain important, but near-term growth, earnings revisions, and the valuation multiple are now governed by custom accelerator and networking deployments.
Core Operating Metrics and Changes
The September 2 earnings release is the immediate research trigger. It confirmed that the USD 16.0 billion Q3 AI semiconductor outlook given in June was exceeded, but the September 3 share-price decline showed that investors were focused on the next incremental acceleration rather than the reported beat.
|
Metric or event
|
Latest value
|
Comparison
|
Basis
|
Investment meaning
|
|
Revenue
|
USD 29.59 billion
|
86% year over year; 33% sequentially
|
GAAP, Q3 FY2026
|
AI shipments produced another sharp upward step in the earnings base
|
|
AI semiconductor revenue
|
USD 16.7 billion
|
221% year over year; 54% sequentially
|
Company-defined category
|
Broadcom has become a concentrated custom-AI and networking exposure
|
|
GAAP / non-GAAP operating income
|
USD 15.96 billion / USD 20.10 billion
|
171% / 92% year over year
|
Non-GAAP excludes amortization, stock compensation, restructuring, and other items
|
Strong leverage, but the adjusted measure excludes USD 2.0 billion of quarterly stock compensation
|
|
Operating cash flow / free cash flow
|
USD 14.20 billion / USD 13.67 billion
|
98% / 95% year over year
|
Free cash flow equals operating cash flow less USD 0.53 billion of capital expenditure
|
A 46% free-cash-flow margin validates the asset-light model
|
|
Q4 outlook
|
USD 34.8 billion revenue; 66% non-GAAP operating margin
|
93% revenue growth
|
Company guidance for quarter ending November 1, 2026
|
Implies roughly USD 23.0 billion of non-GAAP operating income
|
|
Market reaction
|
2.7% decline on September 3
|
USD 357.16 close versus USD 367.24 prior close
|
Dated secondary market data
|
Confirms an elevated hurdle rate despite excellent reported growth
|
Broadcom delivered more than a routine beat. Q3 AI revenue exceeded the prior USD 16.0 billion outlook by roughly USD 0.7 billion, while Q4 guidance calls for another USD 5.0 billion sequential increase. However, the guide was only slightly below the non-primary consensus cited after the release. The share reaction therefore reflects a valuation problem rather than a business deterioration: reported fundamentals are accelerating, while expectations are accelerating almost as quickly.
3. Fundamental Quality
|
Item
|
FY2025
|
Q3 FY2025
|
Q3 FY2026
|
Nine months FY2026
|
Research judgment
|
|
Revenue
|
USD 63.89 billion
|
USD 15.95 billion
|
USD 29.59 billion
|
USD 71.09 billion
|
AI has reset the revenue scale and growth rate
|
|
GAAP gross margin
|
Approximately 68%
|
67.1%
|
69.1%
|
69.0%
|
Mix pressure has been more than offset by scale and software economics
|
|
GAAP operating income
|
USD 25.47 billion
|
USD 5.89 billion
|
USD 15.96 billion
|
USD 35.31 billion
|
Operating leverage is real even before adjustment
|
|
GAAP diluted EPS
|
USD 4.77
|
USD 0.85
|
USD 2.68
|
USD 6.09
|
Earnings are catching up rapidly with the valuation
|
|
Operating cash flow
|
USD 27.54 billion
|
USD 7.17 billion
|
USD 14.20 billion
|
USD 32.95 billion
|
Cash growth broadly confirms reported profit growth
|
|
Free cash flow
|
USD 26.91 billion
|
USD 7.02 billion
|
USD 13.67 billion
|
USD 31.94 billion
|
Exceptional conversion, though working capital is becoming larger
|
|
Capital expenditure
|
USD 0.62 billion
|
USD 0.14 billion
|
USD 0.53 billion
|
USD 1.01 billion
|
Still asset-light, but rack and system commitments are expanding off balance sheet
|
|
Cash / gross debt
|
|
USD 10.72 billion / not shown
|
USD 23.98 billion / USD 59.42 billion
|
Not applicable
|
Net debt has fallen to roughly USD 35.4 billion and is manageable against cash generation
|
Note: Gross margin is calculated as reported gross margin divided by revenue. Free cash flow is the company's measure of operating cash flow less purchases of property, plant, and equipment. FY2025 gross debt combines short- and long-term debt. Q3 FY2026 gross debt is USD 2.25 billion of short-term debt plus USD 57.17 billion of long-term debt.
Growth and margins. Broadcom's growth quality is unusually high because revenue acceleration is accompanied by expanding GAAP profitability. Q3 GAAP gross margin reached about 69.1%, above 67.1% a year earlier, even as semiconductor mix increased by 13 percentage points. That outcome suggests scale, product value, and software profitability are offsetting the lower structural margin of hardware. Still, AI semiconductor concentration means quarterly growth will become less smooth as individual customer programs move between development, qualification, and volume deployment.
Cash flow and capital intensity. The company converted 46% of Q3 revenue into free cash flow. Receivables increased to USD 13.7 billion and inventory doubled from the fiscal-year-end level to USD 4.5 billion, consistent with a much larger shipment base but also worth monitoring. Broadcom's direct capital expenditure remains low because external foundries and packaging partners carry most manufacturing assets. The June quarter filing also disclosed an arrangement under which an investor partner would purchase certain AI racks and enter customer leases, with Broadcom backstopping customer lease obligations. That structure may preserve reported capital efficiency while creating contingent risk not captured by simple capex.
Balance sheet and capital allocation. Cash increased by USD 7.8 billion over the first nine months while gross debt declined by about USD 5.7 billion from fiscal year-end. Net debt near USD 35.4 billion is less than one quarter of annualized Q3 operating cash flow. The balance sheet is therefore strong enough to support dividends and debt repayment. However, nine-month stock compensation of USD 6.3 billion and USD 8.45 billion of repurchases mean headline buybacks should not be mistaken for equivalent per-share value creation.
Fundamental conclusion. Fundamental quality is strong. The single most important future variable is not group revenue growth in isolation; it is whether custom AI accelerator and networking programs can sustain very high growth without customer concentration, financing structures, or a lower-margin hardware mix degrading free-cash-flow conversion.
4. Industry and Competitive Landscape
Broadcom competes across several connected markets rather than a single semiconductor category. NVIDIA dominates merchant AI accelerators and the software ecosystem around them. AMD is scaling an alternative merchant GPU and rack platform. Marvell competes directly in custom silicon, data-center connectivity, and optical DSP. Arista sells high-performance Ethernet systems that often incorporate merchant silicon, including Broadcom chips, while also competing for network architecture control. In software, VMware competes with public cloud, Nutanix, Red Hat, Microsoft, and open-source virtualization and container platforms.
|
Competitive dimension
|
Broadcom's verifiable position
|
Scale measure and limitation
|
Competitors or substitutes
|
Valuation implication
|
|
Custom AI compute
|
USD 16.7 billion of Q3 AI semiconductor revenue includes custom accelerators and networking
|
Company does not split accelerator revenue from networking or disclose customer-level units
|
NVIDIA merchant GPUs, AMD Instinct, Marvell custom silicon, internal hyperscaler teams
|
Design wins can create multiyear revenue, but concentration increases earnings duration risk
|
|
AI networking
|
Broad portfolio across Ethernet switches, routing, NICs, PHYs, and optical connectivity
|
No unified public market-share denominator
|
NVIDIA InfiniBand and Ethernet, Arista systems, Marvell connectivity, Cisco
|
Ethernet adoption broadens Broadcom's value per AI cluster
|
|
Private cloud software
|
VMware Cloud Foundation is the core product, supported by mainframe and security portfolios
|
Infrastructure software revenue of USD 8.75 billion is broader than VMware alone
|
Microsoft, public cloud, Nutanix, Red Hat, open-source virtualization
|
Retention and pricing determine whether software deserves a recurring-revenue premium
|
|
Supply chain
|
Asset-light model relies on foundry, advanced packaging, memory, optical, and system partners
|
Direct capex understates ecosystem capital required for shipment growth
|
Competing customers for TSMC, packaging, HBM, substrates, and optical capacity
|
Low capex supports cash flow, but shortages can interrupt revenue conversion
|
|
Customer economics
|
Custom products lower workload-specific cost and increase customer control
|
No customer-level gross margin or unit economics disclosed
|
General-purpose GPU flexibility versus custom-silicon efficiency
|
Broadcom wins where scale justifies customization; merchant GPUs win where flexibility dominates
|
|
Company
|
Latest comparable period
|
Revenue or key KPI
|
Growth / margin
|
Operating and investment status
|
Competitive conclusion
|
|
Broadcom
|
Q3 FY2026 ended August 2
|
USD 29.6 billion revenue; USD 16.7 billion AI semiconductor revenue
|
86% revenue growth; 69.1% GAAP gross margin
|
Custom accelerators, Ethernet networking, and VMware are scaling together
|
Net winner in custom AI and networking, with valuation as the main constraint
|
|
NVIDIA
|
Q2 FY2027 ended July 26
|
USD 96.2 billion revenue; USD 89.0 billion Data Center revenue
|
106% revenue growth; 75.0% GAAP gross margin
|
Rubin is in production; full-stack compute and networking remain the scale leader
|
Overall AI infrastructure winner and Broadcom's strongest substitute in compute
|
|
AMD
|
Q2 2026 ended June 27
|
USD 11.5 billion revenue; USD 6.7 billion Data Center revenue
|
50% revenue growth; 54% GAAP gross margin
|
Helios, EPYC, Instinct, and Pensando broaden the rack-scale offering
|
Improving merchant alternative, but still behind NVIDIA in ecosystem and Broadcom in custom scale
|
|
Marvell
|
Q2 FY2027 ended August 1
|
USD 2.74 billion revenue
|
37% revenue growth; 53.1% GAAP gross margin
|
Custom silicon and data-infrastructure connectivity are expanding from a smaller base
|
Credible direct challenger, but Broadcom is winning on scale and current revenue conversion
|
|
Arista Networks
|
Q2 2026 ended June 30
|
First quarter above USD 3.0 billion revenue
|
40% non-GAAP EPS growth
|
AI Ethernet systems benefit from hyperscale network buildouts
|
Winner at the systems layer and often complementary to Broadcom silicon
|
Note: Fiscal calendars and business definitions differ. Broadcom's AI semiconductor revenue combines custom accelerators and networking, while NVIDIA and AMD Data Center revenue includes broader compute and networking portfolios. Arista's release headline provides the nearest current scale marker rather than a fully comparable segment metric.
NVIDIA is winning the largest absolute AI profit pool because its merchant platform combines leading accelerators, networking, systems, and a deep software ecosystem. Broadcom is winning the custom-silicon and Ethernet value pool as hyperscalers seek workload-specific economics and greater architectural control. AMD is gaining relevance but remains the challenger; Marvell has credible technology yet currently converts a much smaller revenue base. Arista is also winning, but mainly at the network systems and software layer, where its growth can complement demand for Broadcom switching silicon.
Broadcom is therefore a net beneficiary of the AI infrastructure cycle. Its advantage is not that custom ASICs eliminate GPUs. Instead, the total market is becoming large enough for merchant GPU clusters and customer-specific accelerators to coexist. Broadcom captures value when the workload is stable, volumes are very high, and customers can justify the development expense. The downside is that this model ties revenue to a small number of customer road maps, making any design delay more visible than it would be in a diversified merchant product business.
5. Key Risks
-
Customer concentration and deployment timing. If a major hyperscaler delays a custom accelerator, changes suppliers, or reduces its deployment plan, the direct revenue loss would be amplified by lower networking and optical demand. A Q4 AI semiconductor result below approximately USD 20.6 billion, more than 5% under guidance, would be an early warning.
-
Expectation and valuation compression. At roughly 44 times trailing free cash flow and about 17 times estimated FY2026 revenue on an enterprise-value basis, the stock requires growth well beyond the next quarter. Merely meeting guidance without extending the FY2027 and FY2028 trajectory could contract the multiple even as earnings rise.
-
Margin dilution from hardware mix. Semiconductor solutions increased to 70% of revenue from 57% a year earlier. If non-GAAP operating margin falls below 63% or free-cash-flow margin drops below 40% while AI revenue rises, the market may conclude that revenue scale is being purchased at weaker economics.
-
VMware renewal and ecosystem risk. Customers may resist contract consolidation, higher pricing, or product bundling and migrate workloads toward public cloud, Nutanix, Red Hat, or open-source stacks. Infrastructure software growth below 15% would indicate that the cash-flow ballast is weakening.
-
Supply-chain and contingent financing risk. Broadcom depends on external foundries, advanced packaging, HBM, substrates, optics, and rack partners. Capacity constraints can delay revenue, while lease backstops or other partner financing structures can create obligations not visible in direct capex.
-
Accounting adjustment and dilution risk. Q3 non-GAAP operating income exceeded GAAP operating income by USD 4.1 billion, and nine-month stock compensation reached USD 6.3 billion. If repurchases fail to offset issuance or adjusted metrics diverge further from per-share cash value, reported non-GAAP growth will overstate shareholder economics.
-
Debt, regulation, and acquisition legacy. Gross debt of about USD 59.4 billion is manageable today, but higher interest costs, tax changes, VMware regulatory remedies, or another major acquisition could redirect cash away from debt reduction and shareholders.
6. Monitoring Checklist
-
Q4 FY2026 AI semiconductor revenue: at least USD 21.7 billion strengthens the thesis; below USD 20.6 billion weakens it materially.
-
Q4 consolidated revenue: approximately USD 34.8 billion is the minimum clean execution marker; a miss larger than 2% would signal shipment or non-AI softness.
-
Non-GAAP operating margin: around 66% confirms scale economics; below 63% would indicate hardware-mix or pricing pressure.
-
Free-cash-flow margin: above 42% supports the quality premium; below 40% would challenge the current valuation framework.
-
Infrastructure software growth: above 20% supports VMware retention and pricing; below 15% suggests the cash engine is losing momentum.
-
Receivables and inventory: growth materially faster than revenue for two consecutive quarters would point to weaker collection or demand matching.
-
NVIDIA, AMD, Marvell, and Arista disclosures: continued triple-digit data-center growth and rising Ethernet adoption validate market expansion; slowing hyperscaler deployments across several vendors would signal a cycle peak.
-
Net debt and share count: further net-debt reduction with a stable diluted share count would confirm capital discipline; renewed dilution or acquisition-funded leverage would weaken it.
7. Sources
Data boundary: Broadcom had furnished its Q3 results on Form 8-K, but a full Q3 Form 10-Q was not available in the reviewed source set as of September 9, 2026. Balance-sheet and cash-flow details therefore use the company's earnings-release tables, while contingent AI rack arrangements rely on the preceding quarter's Form 10-Q. Peer periods and segment definitions are not identical and are used as directional operating comparisons.