Author: LBank Research Analyst: Ludo
Disclaimer: This report is compiled and analyzed from publicly available information and is intended solely for information sharing and research discussion. It does not constitute investment advice, a securities recommendation, a trading instruction, or any guarantee of returns. The company operations, valuations, market prices, and consensus expectations discussed herein may change over time. Readers should independently verify the data and make their own decisions.
1. Core Conclusion
The reference stock price is the October 27 regular-session close of USD 320.58. This report freezes information at 11:20 Beijing time on October 28, before the scheduled Q3 release. GOOGLON is an Ondo tokenized exposure traded on LBank; its quote and legal rights are separate from Nasdaq Class A shares. All equity valuation calculations below use the underlying stock reference, not the token price.
-
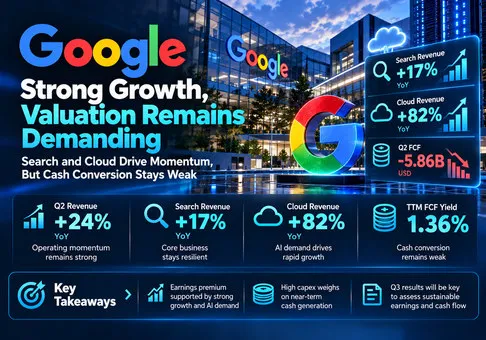
Operating momentum supports the franchise. Q2 revenue grew 24%, with Search growing 17% and Cloud 82%. Alphabet remains a net operating beneficiary of AI demand because it can monetize both consumer intent and enterprise infrastructure. That supports an earnings premium, provided growth produces adequate returns on the capital being deployed.
-
Headline EPS materially overstates recurring earnings power. Q2 diluted EPS of USD 9.11 included USD 6.26 from equity-security gains, as disclosed by the company. Subtracting that contribution leaves USD 2.85. Annualizing this single quarter gives USD 11.40 and a 28.1x reference multiple. This is our limited analytical adjustment, not company guidance or a comprehensive non-GAAP measure.
-
Cash conversion is the weak point. Q2 operating cash flow of USD 39.069 billion fell short of cash capex of USD 44.924 billion, producing negative USD 5.855 billion FCF. TTM FCF of USD 53.273 billion implies only a 1.36% yield against an indicative USD 3.921 trillion equity value. That yield leaves substantial dependence on future cash recovery.
-
Cloud growth deserves a mixed-quality test. The 10-Q says TPU system recognition started in Q2, while most revenue from the relevant agreements is expected in 2027. Infrastructure consumption and hardware deliveries have different timing and repeatability. Treating the entire segment as recurring software would overstate the durability of its economics.
-
The earnings hurdle is operating evidence rather than another large investment mark. The October 23 secondary consensus snapshot is USD 127.9 billion revenue and USD 3.00 EPS. Our base case is continued strong demand with constrained cash conversion. A revenue beat without improved cash economics would leave the neutral valuation judgment intact.
For an explicit valuation sensitivity, our illustrative annual EPS assumptions are USD 10.60, USD 12.00, and USD 13.40, paired with 24x, 28x, and 32x multiples. The resulting equity values per share are USD 254.40, USD 336.00, and USD 428.80, or approximately -20.6%, +4.8%, and +33.8% versus the reference price. These are conditional research scenarios, not price targets. The base case provides limited upside; the bull case requires both sustained growth and better capital productivity. Investment assets could add economic value, but their volatile marks cannot be capitalized as if they were perpetual operating income.
2. Company Overview, Business Mix, and Core Operating Metrics
Alphabet earns most of its money by connecting consumers and advertisers through Search, YouTube, and partner properties. Advertisers pay for useful access to demand; users generally receive free services. Distribution, relevance, ad measurement, and conversion performance underpin willingness to pay. The relationship matters more than raw query volume: an answer that increases engagement but consumes expensive compute without an ad or paid subscription can weaken unit economics.
The consumer subscription and platform portfolio provides a second monetization route through products such as YouTube Premium, Google One, and Google Play. Hardware extends distribution, but it should not automatically receive the same valuation as a subscription stream. The disclosed combined category prevents a clean public decomposition into recurring software and device revenue.
Google Cloud combines GCP infrastructure and platform consumption, Workspace subscriptions, enterprise services, and sales of TPU systems. Consumption revenue is earned as customers use resources. Subscription revenue is recognized over the service term, while hardware and software product components can be recognized when control transfers, subject to the contractual terms. This creates a material distinction between capacity availability, booked commitments, and recognized sales.
|
Business / Q2 2026
|
Revenue, USD billion
|
Economic model and analytical significance
|
|
Google Search & other
|
63.271
|
Advertising auctions; intent, paid clicks, pricing, and distribution determine monetization.
|
|
YouTube ads
|
11.055
|
Video advertising; creator economics and engagement influence inventory quality.
|
|
Google Network
|
7.303
|
Partner-site advertising; declining revenue indicates pressure in a smaller distribution channel.
|
|
Subscriptions, platforms, and devices
|
12.911
|
Consumer subscriptions, app-platform fees, and hardware; mixed revenue quality.
|
|
Google Services subtotal
|
94.540
|
Operating income USD 39.544 billion; the four rows above are components, not additional segments.
|
|
Google Cloud
|
24.768
|
Consumption, subscriptions, and TPU system sales; operating income USD 8.814 billion.
|
|
Other Bets
|
0.382
|
Transportation and internet services; operating loss USD 1.799 billion.
|
|
Hedging / consolidated total
|
0.106 / 119.796
|
Corporate operating loss USD 5.789 billion reconciles segment profits to the group.
|
Q2 revenue mix was approximately 78.9% Google Services and 20.7% Google Cloud. Cloud contributed 18.2% of the two major profitable segments' combined operating income before Other Bets and corporate costs. The latter qualification matters: shared model development costs sit partly outside Cloud, so segment margins do not represent the full group cost of competing in AI.
Core operating metrics and changes
|
Operating indicator
|
Verified observation
|
What the next report must clarify
|
|
Search monetization
|
Q2 paid clicks +13%; cost per click +3% YoY
|
Whether engagement converts to paid demand without sharply higher inference expense.
|
|
Cloud growth
|
Q2 revenue +82% YoY; TPU system revenue recognition began in Q2
|
Recurring consumption versus hardware delivery timing and contract economics.
|
|
Cloud profitability
|
Q2 segment margin 35.6%, calculated
|
Whether improved utilization survives depreciation and product-mix changes.
|
|
Backlog
|
June 30 Cloud RPO USD 513.9 billion
|
Conversion timing and concentration; short-duration contracts entered the definition in Q1.
|
|
Next event
|
Q3 call October 28, 4:30 p.m. ET / October 29, 04:30 Beijing
|
This is a preview; no Q3 outcome is assumed.
|
|
Consensus reference
|
October 23 secondary snapshot: revenue USD 127.9 billion; EPS USD 3.00
|
Estimates can change; reported EPS may again include investment marks.
|
The Search volume-price bridge is useful but approximate: 1.13 multiplied by 1.03 minus one equals 16.4%, close to the reported 17% revenue growth after rounding and mix differences. It provides evidence that demand and monetization both contributed. It does not establish that every incremental AI query is profitable, because paid clicks cover monetized activity and do not identify total inference expense.
We would interpret a strong Q3 as roughly USD 133 billion revenue and USD 3.35 EPS excluding material equity marks, together with a credible cash recovery. Our base scenario is approximately USD 128 billion and USD 3.00, while a weak case is USD 123 billion and USD 2.65. These are analyst assumptions, not verified consensus by scenario. Price implications follow the annual earnings sensitivities in Section 1; the quarterly numbers should not be mechanically multiplied into a forecast because seasonality, taxes, and infrastructure timing matter.
A capacity shipment can move revenue between quarters without changing lifetime customer value. Conversely, an unfilled capacity commitment can delay consumption even when customer demand remains healthy. The next call therefore needs to explain the source of growth, not merely its percentage. A larger backlog is encouraging only when capacity, delivery, customer financing, and payment terms allow profitable conversion.
3. Fundamental Quality
|
Metric, USD billion unless specified
|
Q2 2025
|
Q1 2026
|
Q2 2026
|
|
Revenue
|
96.428
|
109.896
|
119.796
|
|
Operating income
|
31.271
|
39.696
|
40.770
|
|
Operating margin, calculated
|
32.4%
|
36.1%
|
34.0%
|
|
Diluted EPS, USD
|
2.31
|
5.11
|
9.11
|
|
Operating cash flow
|
27.747
|
45.790
|
39.069
|
|
Cash purchases of property and equipment
|
22.446
|
35.674
|
44.924
|
|
FCF = operating cash flow minus cash capex
|
5.301
|
10.116
|
-5.855
|
|
Stock-based compensatio
|
5.998
|
6.751
|
7.957
|
Quarterly figures are from the Q2 release and 10-Q. Q1 revenue, operating income, and stock-based compensation are calculated as H1 less Q2; margins and FCF are calculated. FCF is a non-GAAP liquidity measure defined here as operating cash flow less cash purchases of property and equipment. It excludes acquisitions and does not deduct stock-based compensation as an additional cash expense.
Growth quality is strong at the operating level, but less clean below operating income. Investment appreciation can represent real balance-sheet value while remaining unsuitable as a recurring earnings base. The USD 2.85 EPS bridge removes only the specifically disclosed equity-gain contribution. It retains other non-operating items, litigation expense, and the reported tax framework; it should not be presented as a fully normalized earnings estimate.
Profitability has improved year over year, yet sequential compression shows why growth alone cannot settle the debate. New infrastructure brings depreciation, power costs, and operating overhead before its full revenue potential is reached. A higher Cloud margin can coexist with rising corporate AI research expense. For valuation, consolidated profitability provides a necessary check on segment-level optimism.
Cash quality is weaker than operating profit growth suggests. The Q2 shortfall does not prove that the infrastructure program will fail: the payment for an asset occurs before much of its associated revenue. It does mean the burden of proof shifts to utilization and future cash recovery. A forecast that adds back growth capex without estimating maintenance needs and the incremental return on that growth would be too generous.
The balance sheet is liquid, although funding and investment assets require separate analysis. Cash and marketable securities were USD 242.474 billion at June 30 versus USD 126.843 billion at December 31; long-term debt increased from USD 46.547 billion to USD 98.165 billion. June financing included approximately USD 49.6 billion net equity and mandatory-convertible proceeds. These resources improve financing flexibility, but proceeds from securities issuance are not operating cash creation. Marketable securities can also fluctuate in value, and preferred equity creates claims ahead of common shareholders.
Capital allocation is therefore in an investment phase. H1 stock repurchases were zero, while stock-based compensation and new securities can expand the claims sharing future profits. Assessing the program on enterprise growth alone would miss the per-share outcome. The indicative equity value uses June 30 aggregate Class A, B, and C shares of 12.230 billion multiplied by the Class A reference price; it approximates the share classes at one price and excludes future preferred conversion. It is a reproducible reference, not a precise live market capitalization.
Reproducible business-to-value transmission
Consider an illustrative 10% sequential increase from the Q2 Cloud revenue base. Incremental quarterly revenue would be 24.768 × 10% = USD 2.4768 billion. At an assumed 30% incremental operating margin, this produces USD 0.7430 billion incremental operating profit. Applying an assumed 20% tax rate gives USD 0.5944 billion after-tax operating profit, or USD 2.3777 billion on a simple annualized basis.
For a deliberately transparent cash sensitivity, assume incremental depreciation equals incremental maintenance capex and working capital is unchanged. Before additional growth capex, that annual amount is an approximate incremental cash contribution. If supporting it requires USD 2 billion of additional annual growth capex, the near-term FCF contribution falls to approximately USD 0.3777 billion. If it requires USD 4 billion, the contribution becomes negative USD 1.6223 billion. These are assumptions, not estimates of Alphabet's actual marginal spending.
Capitalizing the pre-growth-capex contribution at an illustrative 25x produces USD 59.44 billion, or approximately USD 4.86 per June common share, before financing effects. This is a scale illustration, not an additive price target; capitalizing it while also charging all investment permanently would mix incompatible valuation methods. The comparison shows why even fast Cloud growth cannot by itself justify a large rerating. The single most important variable is sustainable after-tax cash generation per incremental unit of AI capital.
4. Industry and Competitive Landscape
Alphabet competes across advertising, enterprise computing, AI models, productivity tools, and specialized chips. The economic boundaries overlap: the same infrastructure can serve internal consumer products or external customers, while advertising cash funds enterprise expansion. Vertical integration can reduce dependence on an outside chip supplier, but it also concentrates technological and capacity risk inside the company.
|
Competitive arena
|
Relevant competitors / scale evidence
|
Our industry judgment and valuation implication
|
|
High-intent advertising
|
Google Search Q2 +17%; Microsoft search ads ex-TAC +10%
|
Google is still monetizing demand effectively; comparisons differ because TAC treatment differs.
|
|
Social and video discovery
|
Meta Q3 revenue +26%; YouTube ads Q2 +13%
|
Meta is winning growth momentum; YouTube must defend attention and advertiser returns.
|
|
Enterprise AI and infrastructure
|
Google Cloud Q2 +82%; Azure +43%; AWS +37%
|
All three are expanding; Google leads reported growth from a smaller base with hardware in its mix.
|
|
Infrastructure economics
|
Cloud models combine chips, energy, buildings, software, and distribution
|
Utilization and delivery economics determine returns; booking growth alone does not establish shareholder value.
|
|
Third-party ad distribution
|
Google Network Q2 revenue down approximately 1%
|
Network is the internal relative loser; this does not establish that the entire advertising industry is shrinking.
|
Industry demand is expanding, but revenue growth is not a clean market-share statistic. Google Cloud includes Workspace and TPU sales, Azure's disclosed growth series covers Azure and other cloud services, and AWS is a separately reported segment. Their mix, accounting, and starting scale differ. We therefore compare momentum and operating evidence rather than infer an exact share transfer from the growth rates.
|
Company / period
|
Revenue or relevant segment, USD billion
|
Growth YoY
|
Operating profitability
|
Comparability
|
|
Alphabet Inc. / Q2 2026
|
119.796 group; 24.768 Cloud
|
24% group; 82% Cloud
|
34.0% group; 35.6% Cloud
|
Cloud includes Workspace and TPU product revenue.
|
|
Microsoft Corporation / FY26 Q4, June 2026
|
90.007 group; 39.306 Intelligent Cloud
|
18% group; 43% Azure
|
45.1% group; 40.6% Intelligent Cloud
|
Intelligent Cloud includes more than Azure; Azure standalone quarterly revenue not disclosed here.
|
|
Amazon.com, Inc. / Q2 2026
|
200.6 group; 42.2 AWS
|
20% group; 37% AWS
|
AWS USD 16.6 billion operating income; 39.3% margin
|
AWS segment comparisons are closer than group comparisons, but product scope differs.
|
|
Meta Platforms, Inc. / Q3 2026
|
64.601 group
|
26% group
|
20.1% GAAP; 35.4% excluding disclosed litigation charge
|
September period; adjustment adds back USD 9.89 billion, not all exceptional items.
|
Margins are calculated from reported amounts, with rounding. Microsoft and Amazon June periods align with Alphabet; Meta's September quarter is the latest available and introduces a period mismatch. Meta's adjusted operating margin uses only its disclosed litigation add-back. None of these margins is a standardized measure of AI profitability, and company-level revenue should not be mistaken for cloud or advertising revenue.
Google is winning reported Cloud growth momentum, while AWS retains a larger disclosed quarterly cloud revenue base in this comparison. Microsoft is winning through enterprise distribution and its broad monetization stack. Meta is winning recent advertising growth momentum, with impression and pricing gains supporting its September result, although that is not a like-for-like comparison with Search. Alphabet's relative internal loser is Network advertising. There is no evidence here that AWS or Azure is losing revenue in absolute terms.
Our net assessment is that Alphabet benefits operationally from the AI cycle, with an unresolved shareholder-return question. Its ability to sell infrastructure, distribute models, and monetize demand gives it several routes to payback. The danger is simultaneous investment in all routes without a sufficiently disciplined measure of incremental returns. A premium multiple is easier to defend when the company can show which layer earns the cash and which layer consumes it.
5. Key Risks
-
AI monetization falls behind usage. If query and model usage rise while paid engagement or subscription conversion weakens, compute costs can outgrow incremental revenue. The effect would flow through Services margins and reduce the earnings multiple justified by user growth.
-
Cloud delivery mix is less repeatable than assumed. If TPU shipments explain a disproportionate share of growth, a delivery delay or customer acceptance issue can move revenue and profit between periods. Applying recurring-services multiples to such growth could exaggerate value.
-
Infrastructure spending outruns utilization. If cash capex continues to exceed operating cash flow without a visible utilization ramp, FCF remains weak and financing needs grow. Depreciation subsequently raises the earnings burden even if spending eventually slows.
-
Customer commitments convert slowly. If large customers reduce consumption, delay deployment, or renegotiate, backlog may convert later than the market expects. RPO is not cash and does not remove execution, counterparty, or concentration risk.
-
Competition increases acquisition and inference costs. If competing assistants change discovery behavior or enterprise vendors discount aggressively, Alphabet may spend more to preserve traffic and workloads. Higher distribution or service costs would weaken the link between revenue growth and per-share profit.
-
Investment marks and capital structure obscure the operating result. A reversal in equity valuations can lower GAAP EPS without an equivalent change in operations. New common issuance, preferred claims, or additional compensation dilution can also reduce common-share participation in operating success.
-
Regulatory remedies impair distribution or monetization. If authorities impose material changes to default placement, ad-tech integration, or app-platform economics, revenue access and margins could deteriorate. This is a conditional transmission risk; the report does not assume a new court outcome after the latest reviewed filing.
6. Monitoring Checklist
The following thresholds are research decision rules, not management guidance or precise forecasts.
-
October 28 earnings and call: compare revenue with the dated USD 127.9 billion reference; a beat strengthens the demand case only when its segment mix is clear. Separate equity-security effects before comparing EPS with USD 3.00.
-
Search monetization: paid-click growth above 10% with non-negative CPC growth would support demand durability; a negative CPC trend alongside higher infrastructure cost would weaken the thesis.
-
Cloud growth and mix: growth above 50% with evidence of broad recurring consumption would strengthen the base case; a sharp slowdown masked by episodic hardware deliveries would weaken it. No unsupported hardware-share estimate is assumed.
-
Profitability: consolidated operating margin of at least 33% and Cloud margin of at least 30% would support the earnings framework. Margin deterioration alongside greater corporate AI expense would require lower profit assumptions.
-
Cash recovery: positive quarterly FCF followed by a two-quarter FCF-to-operating-income ratio above 40% would improve confidence. Continued negative FCF without a credible payback explanation would increase the valuation discount.
-
Backlog conversion and capital commitments: reconcile changes with the June Cloud RPO base and its recognition timetable. Faster revenue conversion with stable credit quality is positive; longer commitments without improved cash collection are weaker evidence.
-
Per-share capital allocation: track diluted shares, preferred dividends, conversion exposure, and any ATM issuance. Common-share growth exceeding 2% YoY without a compensating increase in recurring EPS would weaken the shareholder-return case.
7. Sources
All sources were reviewed on October 28, 2026. Primary financial evidence is prioritized; market data and the consensus reference are explicitly secondary. The three-candidate eligibility screen preceded company selection: GOOGLON, AMDON, and COSTON showed populated official spot interfaces and official entity mappings. Alphabet was selected because of the imminent earnings event and more than 90 days since July 23 coverage; AMD and Costco had more recent coverage. The pages support product eligibility, not a guarantee of current execution, order-book liquidity, or exact token tracking.
Direct command-line LBank requests returned access errors, while the web-reading tool exposed populated official interfaces. Some retrieved market fields may be cached. No LBank quote is used for equity valuation. Q3 financial results were unavailable at the report cutoff, and the October 23 consensus snapshot may differ from the latest pre-release estimates. The selected stock-close series is USD 320.58; another vendor showed USD 320.65, an immaterial difference for the thesis.
-
-
-
-
-
-
Amazon.com Announces Second Quarter Results (https://ir.aboutamazon.com/news-release/news-release-details/2026/Amazon-com-Announces-Second-Quarter-Results/default.aspx?mode=light) — July 30, 2026; AWS segment figures and company-defined FCF.
-
Meta Reports Third Quarter 2026 Results (https://investor.atmeta.com/investor-news/press-release-details/2026/Meta-Reports-Third-Quarter-2026-Results/) — October 21, 2026; September quarter; GAAP and company-disclosed litigation adjustment.
-
-
-
-
Earnings Calendar and Analysis for This Week (https://www.kiplinger.com/investing/stocks/17494/next-week-earnings-calendar-stocks) — October 23, 2026 publication; non-primary consensus snapshot of USD 127.9 billion revenue and USD 3.00 EPS, not a live consensus feed.
-
-
-
-
-
-



 Transfer